

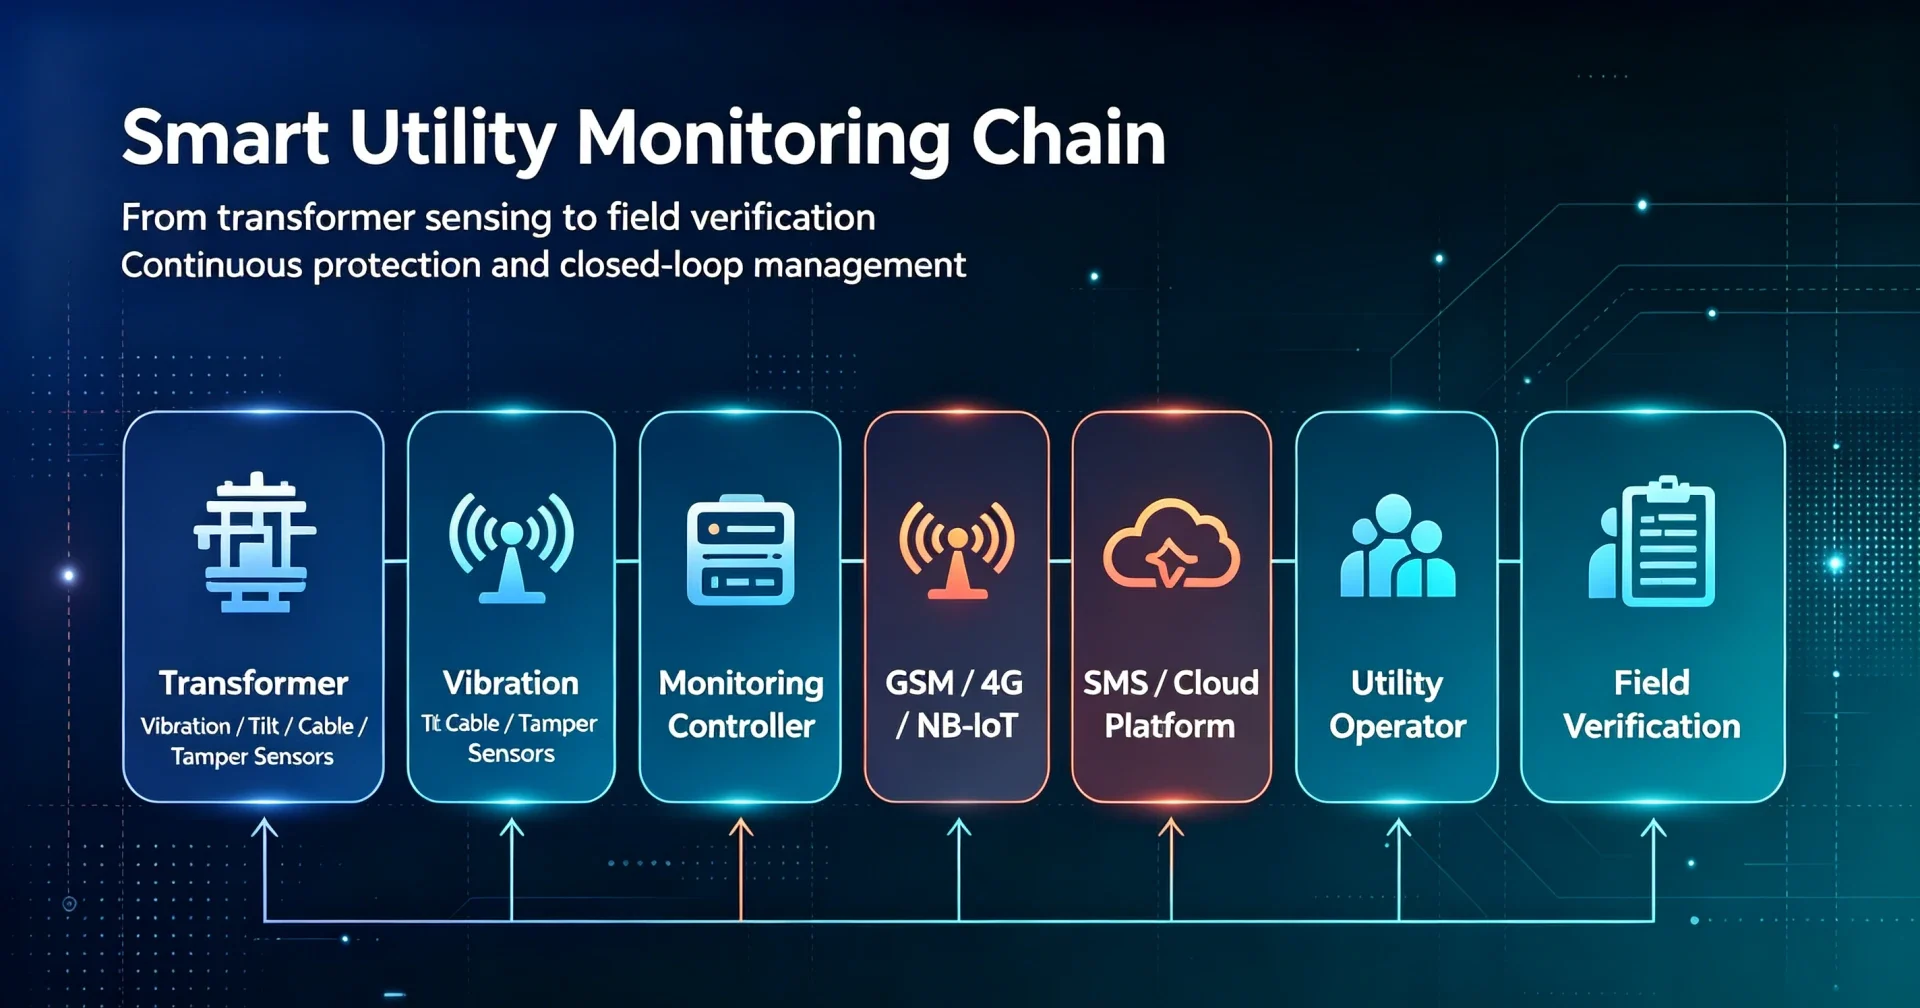
Transformer theft prevention in Africa is a regional problem before it is a technical one, because the same controller, the same sensors and the same alarm logic produce different outcomes in Lagos, Nairobi, Johannesburg and Harare, and the variable that separates those outcomes is the recovery chain behind the crime rather than the hardware on the pole. What differs between those markets is how far a stolen unit has to travel before somebody buys it, how long a replacement takes to arrive once the order is placed, and whether anybody can reach the site before the crew has finished.
That ordering is commercial rather than academic. A programme specified against the wrong failure mode buys a capability the utility cannot use, then measures itself with a number that was never able to move. A utility whose bottleneck is spare parts gains little from a faster alarm, and a utility whose losses sit on the meter gains little from an intrusion sensor. The device is rarely the weak point.
This page treats four countries as four distinct cases, using the figures each utility or regulator publishes, and it separates the reporting units as it goes, because a naira figure for unbilled energy and a unit count for stolen transformers cannot be added together. The wider anatomy of the crime, the parts that get taken first and the sequence a crew follows are covered in the guide to distribution transformer theft.
Key Takeaways
- Four modes explain most of the loss, and each one moves for a different reason: material taken for the scrap chain, energy taken through the meter, units moved along an organised transport corridor, and units that stay stolen because no replacement exists.
- Penalties are not the binding constraint. Zimbabwe provides up to 10 years and Malawi up to 30 years, and both utilities report losses that keep rising, which puts the point of influence somewhere other than the statute book.
- The bottleneck in Zimbabwe is restoration rather than detection. ZESA reported about US$13 million needed to replace damaged transformers against a foreign-currency shortage that delays the spare parts themselves.
- In Nigeria the loss shows up as unbilled energy rather than missing units, and the spread inside the country is wider than the spread between countries: billing efficiency runs from 95.41 per cent at Eko to 60.99 per cent at Yola.
- South Africa’s cases are built on transport and resale, with arrests made on the road rather than at the transformer, which sets a hard limit on what a single-site alarm can achieve.
- The published numbers for different countries are not comparable. Any cross-country percentage used to justify a programme should be rebuilt from units that match.
What Transformer Theft Prevention in Africa Rests On
What decides the outcome of a programme is not the sensor set but three external variables that sit outside the transformer entirely, and in Africa those three vary more between neighbouring utilities than the equipment varies between suppliers on a quotation sheet. The variables are the distance a stolen item travels before somebody buys it, the time a replacement takes to arrive once it has been ordered, and the ability of the operator to act on a report during the same night. Each one is outside the monitoring device as well, which is why specifications copied between countries tend to underperform when they arrive.
The distance to a buyer sets how long the unit is exposed. Where a scrap dealer or a cross-border buyer sits within an hour of the site, the removal window is short and the crew has little reason to hurry quietly. Where the material has to cross a border, interception becomes a customs question rather than an engineering one. In September 2025 the Electricity Supply Corporation of Malawi recovered copper material valued at K1.5 billion after a joint operation with Zimbabwean law enforcement stopped a truck at the Nyamapanda border post. No amount of sensing on the transformer would have produced that outcome; the material was already gone and the recovery happened on a road.
The time to a replacement sets what the alarm is worth. Where a spare unit sits in a regional store, a monitoring report buys a chance to intercept. Where the replacement itself is rationed by foreign currency, the same report buys a record of a loss that will be settled on a waiting list. ZESA of Zimbabwe put the replacement requirement for destroyed transformers at approximately US$13 million and attributed the delay directly to a shortage of foreign currency for spares, which means the recovery clock, not the detection clock, is what governs the outage.
The response capacity at night sets whether the report has an owner. A report that reaches a control room with nobody rostered to a site four hours away is documentation, not protection. Every utility in the region knows this in principle, which is why several have moved the question into security operations rather than maintenance planning, and why the programmes that hold losses down tend to be the ones where a named responder can be reached at 02:00.
| Variable | What sets it | What it changes about the specification |
|---|---|---|
| Distance to a buyer | Local scrap market, border controls, corridor geography | Whether interception is a site decision or a transport decision |
| Time to a replacement | Store stock, procurement rules, access to foreign currency | Whether detection prevents an outage or only dates it |
| Night response capacity | Roster, vehicle availability, road condition | Whether the alarm has an owner at the hour thefts actually occur |
| Statutory penalty | National law | Very little on its own, on the evidence in this region |
The last line of that table is worth stating plainly, because it is the most common misconception in the region. Zimbabwe’s penalties for infrastructure vandalism reach 10 years’ imprisonment, and ZESA has said publicly that the acts persist regardless. Malawi’s Electricity Act of 2024 raises the maximum to 30 years, with an enhanced penalty for employees and former employees, and ESCOM still reports annual losses around K3 billion. The Southern African Power Pool, whose twelve member countries cover most of the region, has begun work on a common infrastructure security framework precisely because national penalties have not settled the problem on their own.
| Jurisdiction | Maximum penalty in force | Reported trend under that penalty |
|---|---|---|
| Zimbabwe | Up to 10 years’ imprisonment for infrastructure vandalism | Damage above US$5 million a year, with 1,500 transformers lost |
| Malawi | Up to 30 years under the Electricity Act 2024, with an enhanced penalty where an employee or former employee is involved | Annual vandalism losses still reported around K3 billion |
| Regional | Sentences of 25 to 30 years in several member states | A common infrastructure security framework is being drafted because national penalties have not settled it |
None of that argues against detection. It argues for placing detection where it can still change something. On a feeder where the journey to site is longer than the removal, the honest value of a sensor is the shortening of the interval between the event and the decision to act, and a programme that claims more than that will be judged against a promise it never made. The layers themselves, and how they are sequenced at a site, are set out on the transformer theft prevention methods page.
The Four Theft Modes Worth Separating
Transformer losses in Africa separate into four modes, each with a different target, a different motive and a different point where an intervention can still change the outcome, and once the modes are separated the argument about equipment largely resolves itself. The four are material theft aimed at the scrap chain, energy taken through the meter under a lawful or tampered connection, organised corridor crime aimed at transport and resale, and a recovery bottleneck created by spare-part scarcity. Two of the four are visible to a sensor on the transformer. Two are not, and no sensor programme will make them visible.
| Mode | What is taken | Where the value is realised | What can still change the outcome |
|---|---|---|---|
| Material theft | Windings, oil, conductor, earthing runs | Scrap dealers, often within the region | Site hardening, tamper and continuity channels, scrap-market enforcement |
| Energy theft | Electricity, through the meter or around it | Sold to unmetered consumers on site | Metering, load records, energy accounting, temperature and load channels |
| Corridor crime | Whole units, copper, tower steel | Resale after a road journey | Transport-window intelligence, joint operations, roadside interception |
| Recovery bottleneck | Nothing further, at that moment | Nowhere; the loss is already booked | Spare-part stock policy, staged delivery, triage of what to repair first |
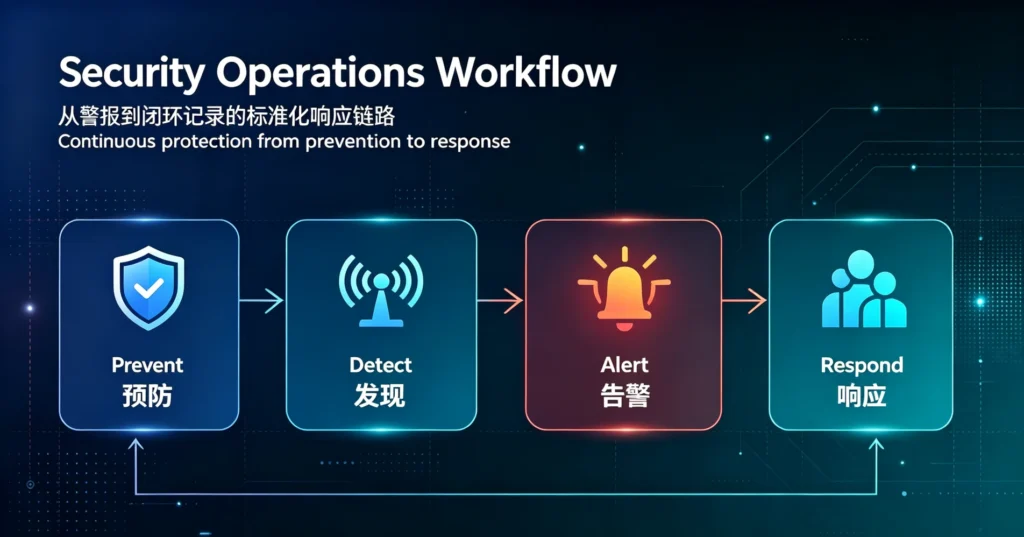
Figure 1: The four modes and the point at which each can still be intervened on; two of them sit outside the transformer.
The first mode is the one most protection equipment is designed for. A crew opens the enclosure, cuts conductor, drains oil or lifts a unit, and each of those actions produces a physical signature. Detection works here because the event has a mechanical phase, and the mechanical phase happens on or around the asset being monitored.
The second mode produces no physical signature at the transformer at all. Energy drawn through an unmetered connection, or metered and then bypassed, damages the utility through the revenue line and eventually through overload. Nigeria’s regulator publishes the size of that flow, and the number is several times larger than anything a per-unit theft count would produce, which is why treating Nigeria as a site-security market misreads the problem.
The third mode is a logistics business wearing an electrical face. Where arrests are made with prohibited firearms and suspects are found moving a transformer along a provincial road, the counter-party is not an opportunist with a spanner but a buyer, a driver and a seller working to a schedule. Interception then depends on intelligence about movement, which is a different product from an alarm on a pole.
The fourth mode is the one that receives the least attention and is the most expensive. Where a unit is destroyed rather than removed, and where its replacement is rationed, the utility carries the outage long after the theft has been recorded. Any programme that improves detection without touching the replacement queue has improved the timeliness of bad news.
| Mode | Mechanical signature at the unit | Visible to a sensor on the transformer | Where the record actually comes from |
|---|---|---|---|
| Material theft | Yes, during the removal itself | Yes | Tamper, continuity and movement channels |
| Energy theft | No mechanical event at all | No | Metering, load and temperature records |
| Corridor crime | Partly, at the moment of lifting or loading | Partly | Movement channel plus transport intelligence |
| Recovery bottleneck | No; the event is already closed | No | Stores, procurement and outage records |
Transformer Theft in Nigeria: The Load Side, Not the Copper Side
In Nigeria the dominant loss is electrical rather than physical, and the size of it is published quarterly: the eleven distribution companies recorded N2.47 trillion of unbilled electricity between 2020 and 2025, with the annual value rising from N281.86 billion to N622.31 billion across that period. The transformers that fail in the same network are more often overloaded by demand that is supplied but never billed than they are removed for their copper, and that distinction changes the first instrument a programme should buy.
The regulator’s own framing supports the reading. Aggregate technical, commercial and collection losses stood at 34.90 per cent in the fourth quarter of 2025 against a regulatory benchmark of 20.54 per cent under the multi-year tariff order, so the sector was operating roughly fourteen percentage points outside the level its tariff assumes. NERC attributes the larger part of that gap to commercial factors including theft, meter bypass and weak energy accounting, and it separates those from the technical losses that occur inside the distribution network itself.
The instruction to vendors sits in the internal spread rather than in the national average. Billing efficiency in 2025 ran at 95.41 per cent at Eko, 90.77 per cent at Ikeja and 90.26 per cent at Kano, while Yola recorded 60.99 per cent, Kaduna 61.56 per cent and Benin 66.18 per cent. A single national figure hides a gap of more than thirty percentage points between the best and worst performers inside one country, which is wider than the gap between most of the countries compared later in this page.
| DisCo | Billing efficiency, 2025 | ATC&C position against the 20.54% benchmark |
|---|---|---|
| Eko | 95.41% | Best-performing operator in the set |
| Ikeja | 90.77% | Comfortably inside the tariff assumption |
| Kano | 90.26% | Comfortably inside the tariff assumption |
| Benin | 66.18% | Losses well outside the benchmark |
| Kaduna | 61.56% | Losses well outside the benchmark |
| Yola | 60.99% | Lowest in the set; losses roughly three times the benchmark gap |
State-level reporting makes the same point more sharply. Jos Electricity Distribution Company has stated that illegal activity accounts for about 45 per cent of the electricity it supplies in Plateau State, a figure that would be unremarkable as a security statistic and is alarming as a commercial one. Where close to half of the supplied energy is not paid for, the transformer is the point at which that energy enters the network rather than the object being attacked, and the monitoring question becomes what the unit is carrying rather than who is standing next to it.
| Question | Energy loss, as reported in Nigeria | Unit loss, as reported in Zimbabwe |
|---|---|---|
| What is being measured | Electricity supplied and never billed | Transformers removed or destroyed |
| Reporting unit | Currency value of energy | Physical unit count |
| First detection channel | Load, temperature and metering data | Tamper, continuity and movement channels |
| Who owns the response | Commercial, metering and revenue teams | Security and maintenance teams |
| What a faster alarm changes | Little; the loss accumulates between audits | Little; it shortens the record, not the queue |
For a programme in this environment the first channels are therefore temperature, load and oil condition on the highest-loss feeders, with a metering audit behind them, because those are the measurements that track the failure mode actually present. A tamper channel still has a place on units that are physically exposed, and the physical side of the problem is set out on the transformer theft detection overview, but it is the second purchase here rather than the first. [UNIQUE INSIGHT]
Transformer Theft in Kenya: Metering Rules and an Export Ban
Kenya attacks transformer theft from the demand side, and the published figures show why a purely physical response has not been enough: Kenya Power recorded the loss of 365 transformers worth Sh328 million in the 2022-23 financial year, an average of about Sh898,630 per unit, and a further 78 units valued at Sh78 million between January and May 2024. The utility’s response has combined field operations with national policy on scrap metal, and the two are difficult to separate in the results.
| Period | Units lost | Reported value | Implied unit value |
|---|---|---|---|
| May to December 2022 | 76 | Sh68 million | About Sh895,000 |
| Financial year 2022-23 | 365 | Sh328 million | About Sh898,630 |
| January to May 2024 | 78 | Sh78 million | About Sh1,000,000 |
The policy side is unusual and worth understanding before specifying anything for a Kenyan utility. In January 2022 the national government classified vandalism of critical infrastructure as economic sabotage and stated that offenders would be treated accordingly, and it suspended the export, purchase and sale of scrap material. The ban on local scrap trading was lifted in May 2022, while the export prohibition remained in place. Kenya is therefore one of the few markets in the region where the disposal channel itself is regulated, and where a monitoring programme can reasonably expect the recovered material to be traceable.
Field reality is more complicated than the policy. In Meru County, Kenya Power reported losses of about Sh100 million a month in the Igembe South area, with an annual figure reaching Sh1 billion, alongside 74 transformers lost to overload in a single financial year and more than 8,000 meters found bypassed or fraudulent. When crews moved to remove the illegal connections, residents and local representatives resisted, and the operation became a negotiation between electrification and enforcement. That episode carries a lesson for monitoring design: an alarm in a location where the surrounding community is itself the beneficiary of the illegal supply will be answered slowly, and the response plan has to be built with that in mind rather than assuming the site is merely unattended.
For a Kenyan deployment the useful channels include continuity and tamper detection on units in the heavily loaded agricultural districts, alongside the load record that identifies when a unit is being pushed beyond its rating by demand it was never sized for. The engineering detail of how a monitoring platform turns those channels into dated events sits on the transformer theft monitoring page, and the sequencing of a Kenyan programme follows the same logic as any other: instrument the units that combine exposure with dispatchable response.
Transformer Theft in South Africa: A Supply Chain, Not a Site
South Africa’s losses are organised rather than opportunistic, and the enforcement record describes a trade in movement: Eskom reported approximately R221 million of infrastructure vandalism and theft in the eleven months from 1 April 2024 to the end of February 2025, down from R271 million in the same period a year earlier, with the arrests that follow made on roads and at premises rather than at the installations themselves. That pattern is what separates this market from an unattended-site problem.
| Case | Date | What was found | What it says about the counter-party |
|---|---|---|---|
| Ngwelezane, KwaZulu-Natal | April 2025 | Six suspects, R1.5 million of Eskom property, two prohibited firearms | A group equipped and willing to resist interception |
| R33, Vryheid to Paulpietersburg | October 2025 | Four suspects, three foreign nationals, an Eskom transformer in transit | Cross-border movement of an assembled unit |
| Mandeni, KwaZulu-Natal | April 2025 | One suspect, R150,000 of electrical items | Storage and resale rather than immediate removal |
Eskom’s own account of the methods matches the arrest pattern. The utility has reported removal of steel structures from pylons, illegal sand mining around pylon bases and siphoning of oil from transformers, and it has noted that draining oil or connecting a unit to an illegal installation can cause it to overheat and explode. Those are not the actions of a crew working against a clock at a single site; they are the actions of a supply chain working a corridor, and several of the cases involve people with working knowledge of how the equipment is installed and removed.
The design consequence is a hard one, and it is better stated than avoided. Where the counter-party is a buyer, a driver and a seller, the value of a single-site alarm is bounded by the transport window it can expose. A tamper or tilt channel that reports a unit in transit gives the operator something it did not previously have, which is a timestamp and a plausible direction, and that information is only worth what the receiving authority does with it. Utilities operating in this environment increasingly treat their distribution monitoring as an input to a security operations room rather than to a maintenance queue.
For a South African scope the practical mix starts with channel selection on exposed units in the provinces that report the most cases, keeps the reporting interval short where the transport window is short, and routes alarms into an environment that has a rostered response. The installation-form question, including which removal methods apply at pole-mounted and pad-mounted sites, is treated separately on the pole-mounted transformer theft page, because the method and the corridor are different problems even when they meet at the same device.
Transformer Theft in Zimbabwe: Detection Is Not the Bottleneck
Zimbabwe is the clearest case in the region of a detection problem that has largely been solved and a recovery problem that has not, and its published figures make the split unusually easy to see: ZESA reported 1,500 transformers, 600 kilometres of conductor and 116 kilometres of medium-voltage cable lost, with more than 21,000 customers enduring outages that lasted up to ten months or longer. The utility put the annual cost of infrastructure damage above US$5 million, with a further US$1.5 million a month in lost potential revenue.
| Reported item | Figure | Why it matters to a programme |
|---|---|---|
| Transformers lost or destroyed | 1,500 | The recovery queue, not the detection rate, sets the outage length |
| Conductor and MV cable | 600 km and 116 km | Continuity monitoring has a large physical surface to cover |
| Customers affected | More than 21,000, some beyond 10 months | Outage duration is the metric the customer experiences |
| Replacement requirement | Approximately US$13 million for transformers alone | Spare-part stock, not alarms, is the binding constraint |
| Cumulative loss since 2019 | About US$24 million | The trend is long enough to be structural rather than seasonal |
The foreign-currency position is the part that changes the specification. ZESA has attributed the delay in restoring supply directly to a shortage of foreign currency, which makes it difficult to procure critical spare parts and lengthens restoration rather than the response to the alarm. In that environment the marginal value of a faster report falls sharply, and the marginal value of a triage rule rises, because the utility has to decide which of the hundreds of damaged units receives the limited stock it can obtain.
A triage rule is a monitoring product, which is the part most often overlooked. If the platform records which units are on which feeder, which loads they carry and how long each has been out, then the spare-parts decision can be made against service impact rather than against the order in which losses were reported. That is a different use of the same data, and in a market where a replacement queue runs for months it is likely to be worth more than a shorter alarm delay.
The legal position reinforces the point. Zimbabwe provides penalties of up to ten years’ imprisonment for infrastructure vandalism, and the national utility has stated publicly that the offences continue regardless of that provision. When the statutory deterrent is already severe and the behaviour is unchanged, what remains available sits in the cost of the operation to the offender, the traceability of the material through the scrap chain, and the speed with which a damaged network is brought back. Only the first of those is an instrument on the transformer, and it is the one most likely to be defeated by a crew that has done this before. [UNIQUE INSIGHT]
Distribution Transformer Losses in Africa: The Comparability Problem
Distribution transformer losses in Africa are reported in units that cannot be added together, and any programme that justifies transformer theft prevention in Africa with a single cross-country percentage is resting on an arithmetic error rather than on a measurement: Nigeria publishes unbilled energy, South Africa and Malawi publish money, Zimbabwe publishes unit counts and lengths of conductor, and Zambia publishes a currency figure for a single year. Four of those are legitimate, and none of them is convertible into the others without assumptions that the sources do not supply.
| Country | What is reported | Published figure | Reporting unit | Why it is not comparable |
|---|---|---|---|---|
| Nigeria | Unbilled electricity, 2020-2025 | N2.47 trillion cumulative; N622.31 billion in 2025 | Currency value of energy | Measures revenue leakage, not hardware removed |
| South Africa | Vandalism and theft cost, Apr 2024 to Feb 2025 | About R221 million | Currency value of damaged assets | Aggregates cable, meters, steel and transformers |
| Zimbabwe | Transformers, conductor and cable lost | 1,500 units; 600 km conductor; 116 km cable | Physical counts | Counts units regardless of rating, and includes conductor |
| Malawi | Annual vandalism loss | About K3 billion | Currency value | Covers all equipment, not transformers alone |
| Zambia | Vandalism loss, 2025 | ZMW 25 million | Currency value | Single-year figure without a unit count |
The practical consequence is a discipline worth applying to any supplier presentation that opens with a percentage. Three questions separate a usable figure from a decorative one. Is the unit physical or monetary, because a currency figure moves with tariffs and exchange rates as well as with crime. Is the scope the transformer alone or all distribution equipment, because conductor and meters usually dominate the total. And is the period comparable, because a cumulative figure since 2019 answers a different question from an eleven-month operating number. A figure that cannot answer all three is a direction of travel, not a scale.
Rebuilt on matching units, the picture is still serious, and it is more useful. Counting units, Zimbabwe’s 1,500 lost transformers against a network of several tens of thousands is a double-digit percentage of the installed base affected over the reporting period. Counting money against revenue, Nigeria’s 34.90 per cent aggregate loss level against a 20.54 per cent regulatory benchmark describes roughly fourteen points of avoidable leakage on the country’s entire distribution revenue. Counting money against asset value, South Africa’s R221 million in eleven months is a material but declining charge on the utility’s capital programme, since the comparable prior-year figure was R271 million. Each statement drives a different decision, which is exactly why they should not be merged.
For anyone scoping a programme, the honest approach is to build the business case from the utility’s own incident record and its own replacement costs, and to use published regional figures only for context. Where a supplier quotes a regional average, ask for the unit, the scope and the period. A transformer theft prevention programme in Africa that survives its first budget review will usually be the one whose numbers came from the utility’s own store, not from a regional average.
Matching the Intervention to the Mode
Once the mode is identified the first instrument follows from it rather than from a product list, and the sequence is not a matter of preference for transformer theft prevention in Africa, because each mode is visible to a different channel and answered by a different team. The order runs as follows: a load and temperature record where demand is the loss channel, a continuity and tamper channel where material is removed, a movement alert with a short reporting interval where the counter-party is a supply chain, and a triage rule where the replacement queue is the binding constraint. Specifying in that order prevents the most common waste in the region, which is a physical-security purchase against a commercial loss.
| Dominant mode | First instrument | Second | What it will not deliver | Local precondition |
|---|---|---|---|---|
| Energy theft | Load and temperature record | Metering audit on the feeder | Any evidence about who was at the site | Metering access and a working billing record |
| Material theft | Continuity and tamper channels | Unit movement alert | Recovery of material already sold | A scrap-market control worth using |
| Corridor crime | Short-interval movement reporting | Route intelligence with authorities | Protection of an individual unit | A response that can act within the transport window |
| Recovery bottleneck | Event record with feeder and load context | Spare-part triage rule | Any reduction in the number of attempts | Stock or procurement access to spares |
The communication layer is deliberately absent from that table, because the choice between GSM, 4G and NB-IoT depends on coverage and data volume at the individual site rather than on the country, and it is treated on the page covering transformer remote monitoring communication instead of being repeated here. The rule that matters at this level is simpler: specify the path that reports reliably at that site at the worst hour, and treat any coverage map as a hypothesis until it is measured on site.
Two channel choices recur across the modes and are worth naming. Cable and earthing continuity is the highest-value first channel in material-theft districts, because advance cutting happens days before the removal and leaves a signature on the monitored circuit, and the engineering of it is described on the transformer cable cutting detection page. Movement and orientation sensing is the channel that survives a change of method, since a unit that is lifted or dragged changes orientation regardless of how the crew intended to deal with the enclosure, and its behaviour is set out on the transformer tilt detection page. A programme that fits those two first, then adds load context, has covered three of the four modes with two sensors and one record.
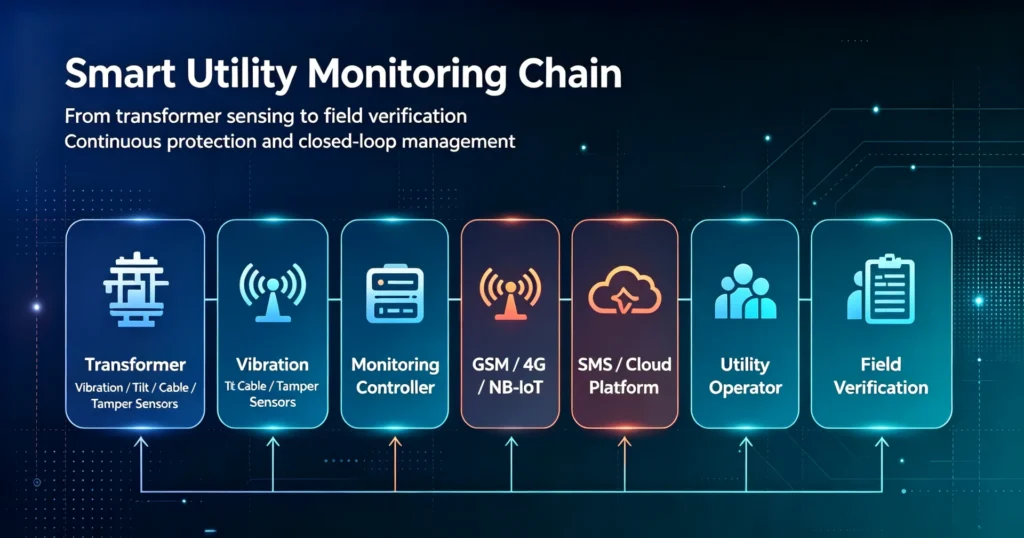
Figure 2: Channel selection mapped to the dominant mode; the communication layer is specified per site rather than per country.
Limitations and Boundaries: What Monitoring Cannot Remove
Five limits hold regardless of the device chosen, and stating them before a purchase is part of the design work rather than a disclaimer attached to it, because monitoring is an information layer that can only change an outcome through the human and the material systems that receive its output. Where those systems are the constraint, a faster alarm changes the record rather than the result.
- It cannot substitute for enforcement. Where the counter-party is an organised supply chain with buyers and transport, a better timestamp on a removal shortens the interval between the event and a decision, and the decision still belongs to a police or security service.
- It cannot shorten a spare-part queue. In a market where restoration is rationed by access to foreign currency, the outage continues regardless of how quickly the loss was detected, and no sensor improves the availability of the transformer that replaces the stolen one.
- It cannot see consumption taken through a lawful connection. Where the loss is energy supplied and never billed, the theft is on the metering and accounting side, and the transformer monitoring channel can only infer it from load and temperature behaviour.
- It cannot report from a site with no network. A site outside coverage can store events and surrender them on a later visit, which is a real capability, but it is not real-time reporting and should not be presented as such at the procurement stage.
- It cannot recover material that has already moved. Once a unit or a coil of conductor is on a road, the recovery is a customs and policing activity, as the K1.5 billion interception at the Nyamapanda border showed, and it is not an outcome the monitoring system produces on its own.
A programme is better placed when it states those limits in its own scope document. The utility that accepts them will size its instrumentation against the response it can actually deliver, will keep the metering and accounting workstream separate from the security workstream, and will not be surprised when a well-functioning alarm system fails to reduce a loss that was never physical in the first place.
How Houfeng Supports African Distribution Programmes
For utilities and EPC contractors working in these conditions the useful output is a configuration that survives the local constraint rather than a catalogue number, so the scope is built backwards from the site survey and the accessories ship as one order. That approach matters most where a missing bracket stops a commissioning for a month because the next shipment is six weeks out.
| Programme element | What is provided | What the client supplies | Why it is handled this way |
|---|---|---|---|
| Configuration for transformer theft prevention in Africa programmes | Channel set selected per mode and per site class | Incident record and feeder list | The mode, not the catalogue, decides the channel set |
| Factory acceptance | Test record against the agreed configuration | Inspection scope and attendance plan | Avoids discovering a channel set mismatch at commissioning |
| Power and autonomy sizing | Battery and panel sizing against reporting interval | Measured coverage and irradiance at the site | Autonomy is a site property, not a device property |
| Spare-part packaging | Critical spares shipped with the main order | Target spare ratio and store location | Protects against the currency-driven delays seen in the region |
| Staged delivery | Shipments sequenced to the installation programme | Installation schedule by district | Reduces site storage and loss during construction |
| Documentation | Wiring, configuration and event-code record | Local language and format requirements | Keeps the event record auditable after handover |
To start, request a datasheet for the reference configuration and compare its channel set, autonomy and event record against the survey figures for the sites in question, or send us your requirement with the mode you have identified, the number of sites in each risk class, the measured coverage class and the response time you can actually deliver, and an application engineer will return a channel list, an autonomy calculation and a spares recommendation. The unit itself, including the tamper and movement behaviour that a site without a routine presence depends on, is specified on the transformer anti-theft monitoring system page.
Frequently Asked Questions
Why is transformer theft a challenge in Africa? Because three conditions meet at the same asset: distribution transformers are installed outdoors and away from staffed premises, the material inside them has a resale value that is realised through a local or cross-border scrap chain, and the networks are large enough that continuous physical supervision of every unit is arithmetically impossible. The result is not a single crime but four distinct problems, which is why a control that works in one country has so little effect in the next.
Which countries in Africa have the highest transformer theft rates? On published figures, Zimbabwe reports the largest physical loss relative to its network, with 1,500 transformers, 600 kilometres of conductor and 116 kilometres of medium-voltage cable, affecting more than 21,000 customers. Kenya reports 365 units worth Sh328 million in one financial year. South Africa reports about R221 million of infrastructure theft and vandalism in eleven months. Nigeria’s loss is larger in monetary terms, N622.31 billion of unbilled electricity in 2025 alone, but it is reported in a different unit, which is why the ranking depends on the measure chosen.
How do you prevent transformer theft in Africa? By identifying which failure mode dominates at that utility before choosing equipment, then instrumenting against it: load and temperature records where energy is the loss channel, continuity and tamper channels where material is removed, short-interval movement reporting where the counter-party moves units along a corridor, and a triage rule where the spare-parts position, not detection, decides how long an outage lasts. A transformer theft prevention in Africa programme built in that order spends its budget on the layer that is actually binding.
Can one configuration serve Nigeria, Kenya, South Africa and Zimbabwe? The device can, and the channel set should not. A single hardware platform with a selectable input set will cover all four, but the channels enabled, the thresholds, the reporting interval and the response routing differ in each case, because the dominant mode differs. Buying four identical configurations is simpler to procure and more expensive to operate, since the unused channels still consume autonomy and generate events that somebody has to triage.
What works at a site with no usable cellular coverage? Three options, in order of cost: an alternate path or repeater where either is economic, a store-and-forward configuration with local storage sized against the gap between visits, or classification as a recording site visited on the normal round. What cannot be done is real-time reporting, and the honest step is to document the site as outside real-time coverage rather than to assume that the coverage map covers it.
Does monitoring help when the bottleneck is spare parts? It helps in a different way than it does elsewhere. A faster alarm does not shorten a restoration queue that is limited by foreign-currency access to spares, but the same event record, once it carries the feeder, the load class and the outage duration, becomes the input to a triage decision about which damaged unit receives the limited stock available. That is a lower-profile use of the same data and, in that market, probably the more valuable one.
How should reported loss figures be compared between countries? Only after three checks: whether the unit is physical or monetary, whether the scope is transformers alone or all distribution equipment, and whether the period is cumulative or a single operating year. Until those are matched, the figures indicate direction rather than scale, and any business case built on a cross-country percentage should be rebuilt from the utility’s own incident record and replacement costs.
Conclusion and References
The workable sequence is to identify which of the four modes dominates at the utility, then let that decision pick the instrument, the reporting interval and the response procedure, because a programme designed against the wrong mode spends its budget on the wrong layer and reports success with a number that was never able to move. In Nigeria that means the meter and the load record. In Kenya it means continuity and tamper channels alongside a load record, with a response plan that anticipates a community interest in the illegal supply. In South Africa it means a short reporting interval wired into a security operations room that can act inside a transport window. In Zimbabwe it means the event record and the triage rule, because the queue for a replacement unit, not the alarm delay, is what governs the outage.
The regional picture supports one further conclusion, and it is the one most often skipped. Transformer theft prevention in Africa cannot be scoped from a regional average, because the published numbers use units that do not convert. Build the case from the utility’s own store, its own incident record and its own measured response time, then use the regional figures only to check that the result is plausible. A programme specified that way answers the budget question in the utility’s own terms, which is the only form of the answer that survives a review.
Sources
- IEEE 1366-2022, IEEE Guide for Electric Power Distribution Reliability Indices (retrieved 4 October 2026).
- IEC 60721-3-4:2019, Classification of environmental conditions — Part 3-4: Stationary use at non-weatherprotected locations, IEC TC 104 (text citation).
- IEC 60529:1989+AMD1:1999+AMD2:2013, Degrees of protection provided by enclosures (IP Code), IEC TC 70 (text citation).
- ZESA Holdings statement on infrastructure theft and vandalism, reported by The Herald (Zimbabwe): 1,500 transformers, 600 km of conductor, 116 km of MV cable, more than 21,000 affected customers and the US$13 million replacement requirement; retrieved 4 October 2026 (text citation).
- Kenya Power loss figures for the 2022-23 financial year and January to May 2024, and the Meru County operating report, carried by TNX Africa and The Star (Kenya); retrieved 4 October 2026 (text citation).
- Eskom infrastructure vandalism and theft cost for 1 April 2024 to 28 February 2025, with the KwaZulu-Natal arrest cases reported by Pretoria News, IOL and News24; retrieved 4 October 2026 (text citation).
- Nigerian Electricity Regulatory Commission billing and loss data for 2020 to 2025, analysed by Punch and The Point NG; retrieved 4 October 2026 (text citation).
- Electricity Supply Corporation of Malawi annual vandalism loss and the September 2025 cross-border copper recovery at Nyamapanda border post, with Southern African Power Pool regional framework reporting, carried by Times Malawi and Nation Online; retrieved 4 October 2026 (text citation).
Written by the engineering content team at Baoding Houfeng Trading Co., Ltd., which works with utilities, EPC contractors and distribution operators on transformer monitoring and protection projects. Technically reviewed by [Reviewer name], senior distribution protection engineer, [X] years in distribution network operations (to be confirmed by the client). Last updated: 4 October 2026.