

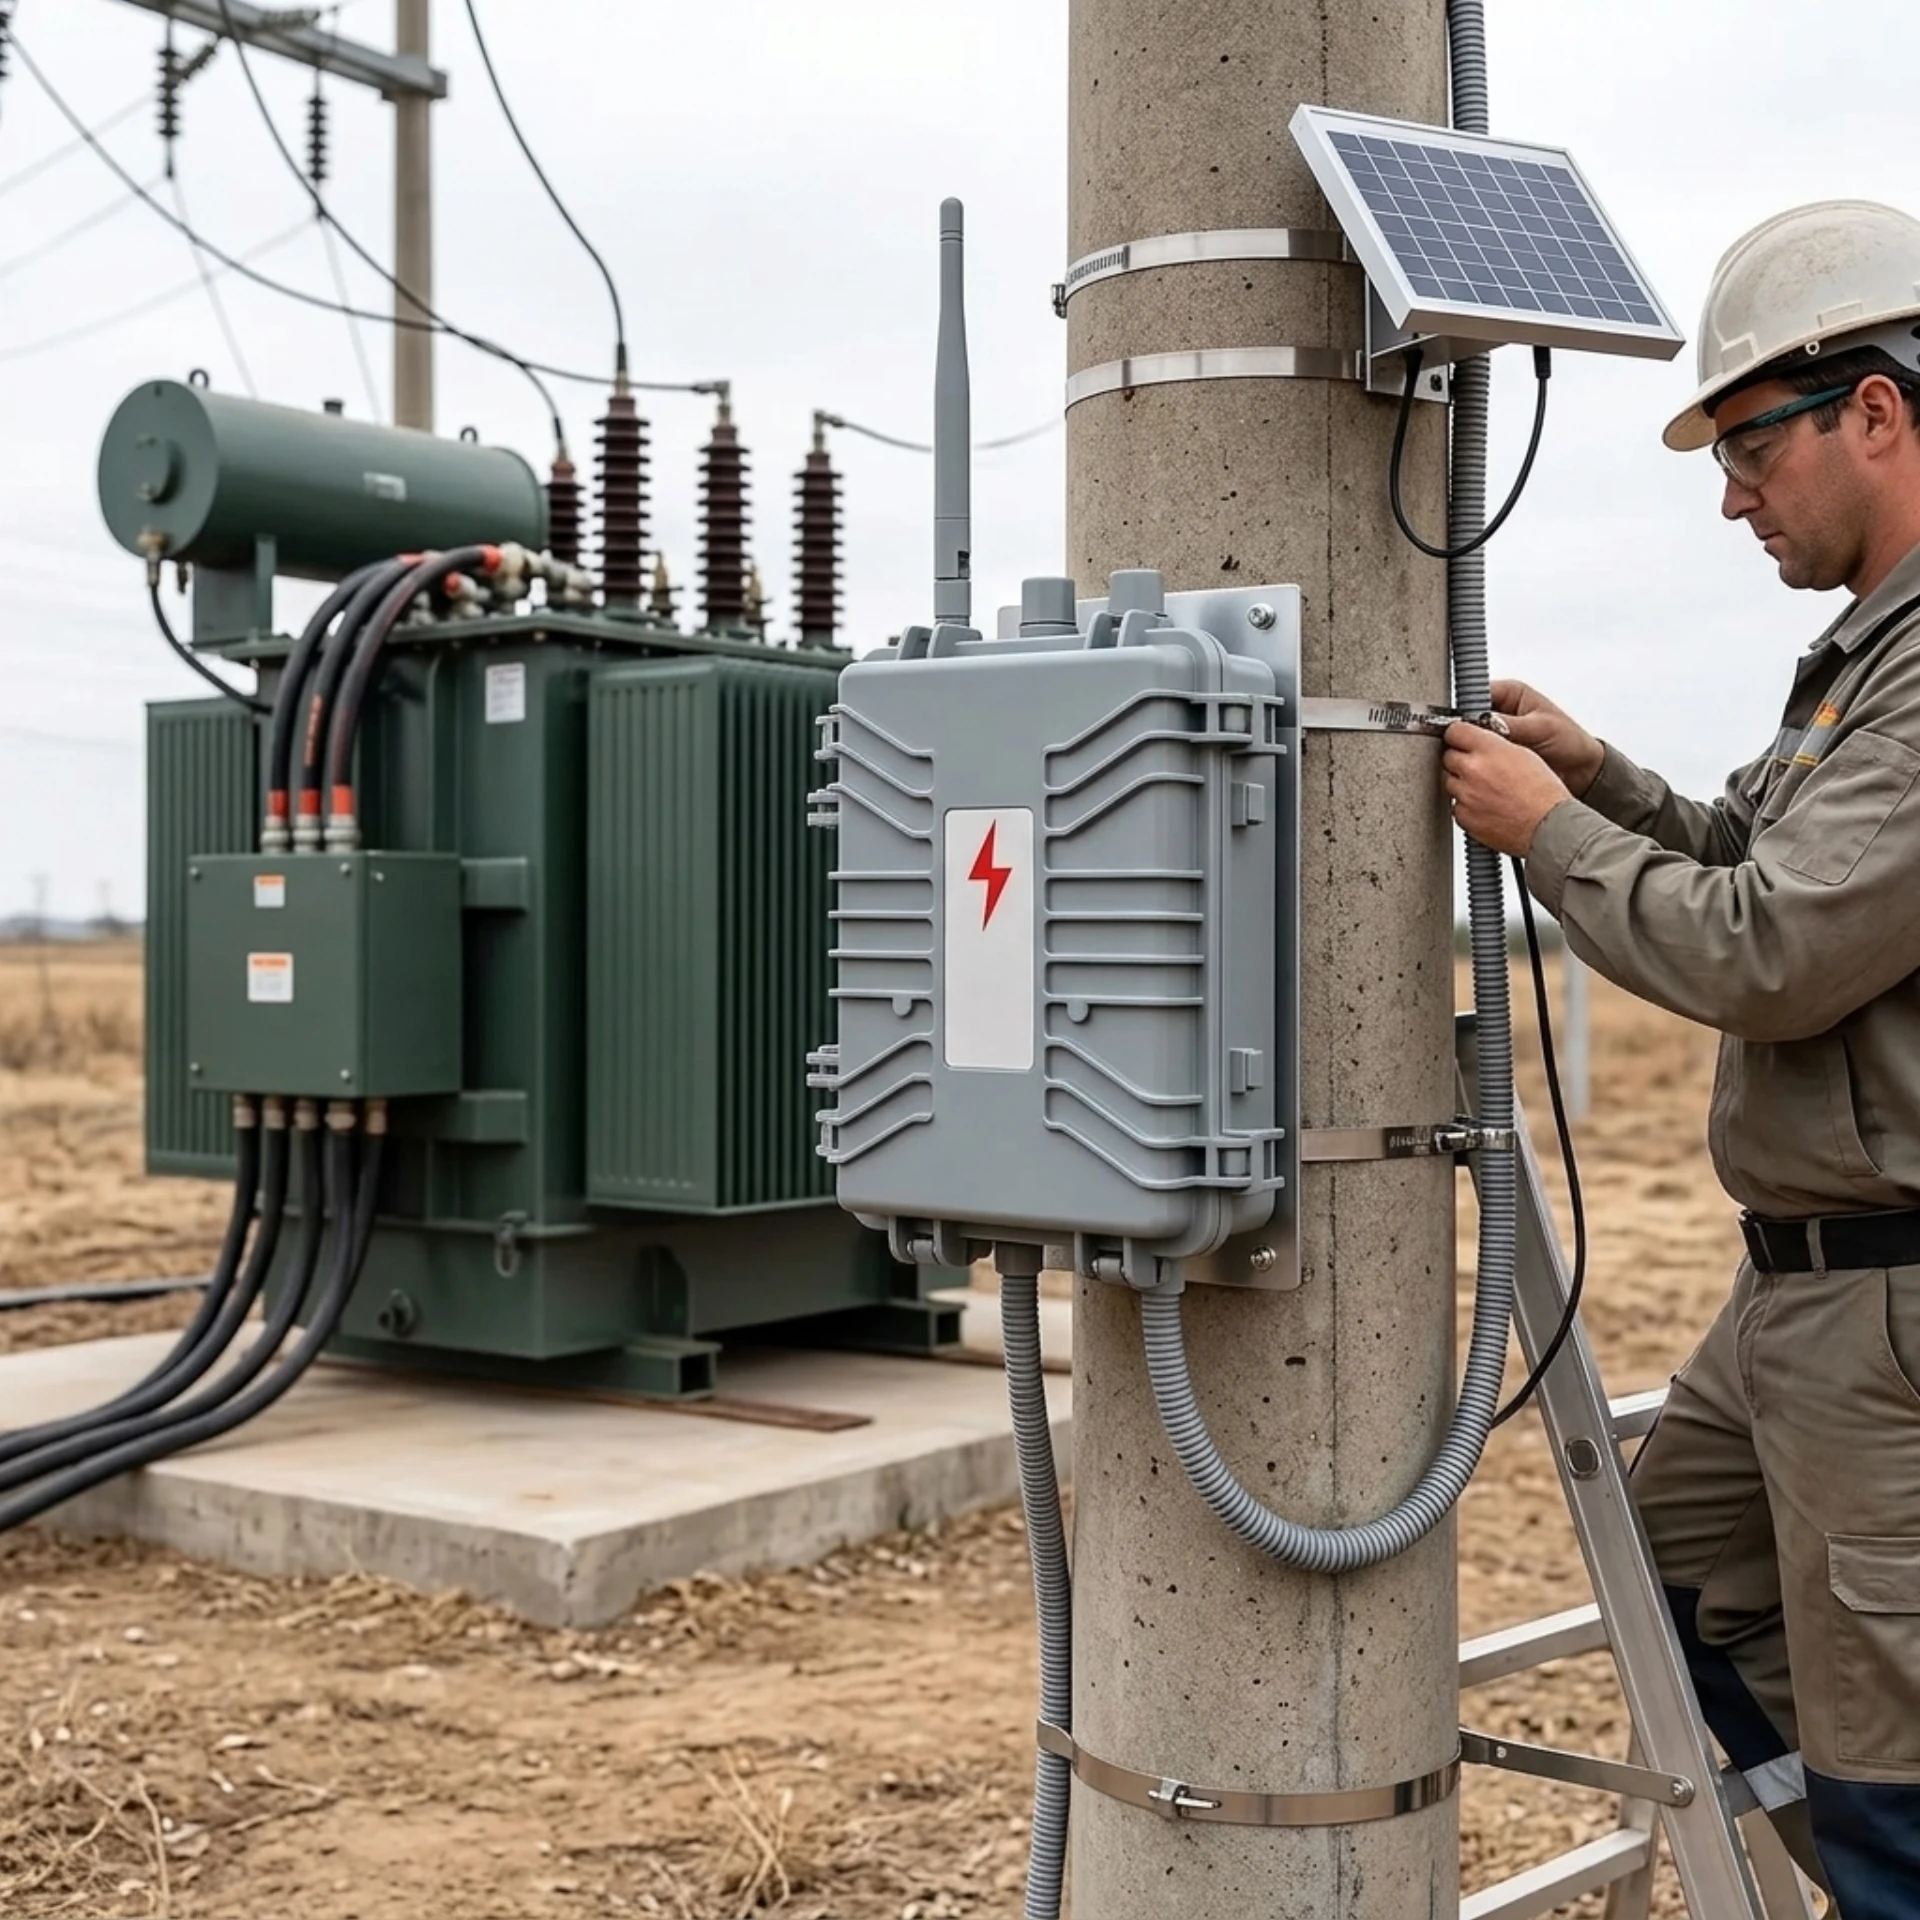
Distribution transformer theft is the unauthorised removal of a distribution transformer or its parts for the valuable materials inside, mostly copper, and utilities now track it as a standing loss category rather than an occasional incident. Crews target these units because they sit in the open, hold tens of kilograms of valuable metal, and are often inspected once a month. This page explains what the crime involves and which parts get taken. It then covers where and how the theft happens, what it costs, and where prevention starts.
Key Takeaways
- Theft of distribution transformers is driven mainly by copper. Thieves strip earthing wires, cables and windings for scrap, and the U.S. Department of Energy puts the national cost of copper theft at nearly $1 billion a year.
- The losses reach far beyond the stolen metal. One event can cut power to a village or an irrigation scheme for days and cost far more in repairs than the copper was worth.
- The crime follows a pattern you can plan against. Remote, unstaffed locations are hit hardest, and the five known methods each leave a signature that monitoring or inspection can recognise.
- Prevention works in layers. Physical measures slow a crew down. Monitoring shortens the time between the attempt and a response. This page explains the problem; the linked pages cover the solutions.
What Is Distribution Transformer Theft?
Distribution transformer theft covers any unauthorised removal of a transformer or of its parts: the whole unit lifted from its pole or pad, the enclosure opened for its copper, earthing conductors and LV cables cut away, or the oil drained for resale. Utilities, EPC contractors and insurers treat it as a single loss category because the response, from inspection through replacement to network reconfiguration, is similar whatever the method used.
Three features separate this crime from ordinary vandalism. First, it is material-driven: the target is metal with a scrap price, and copper is the main draw. Second, it is planned: crews scout the site in advance and arrive with tools, transport and a plan. Third, it is dangerous: opening an energised or back-fed transformer has killed and injured thieves as well as lineworkers who later found a unit in an unsafe state.
A working definition matters for budgeting. When a utility counts incidents, it counts the units that disappeared or were damaged beyond repair, the parts stripped from surviving units, and the outages traced to tampering. One crew working a district for a season can produce dozens of separate losses under that accounting. The pages on how monitoring detects tampering and cable cutting detection describe the signatures each method leaves behind.
Why Are Distribution Transformers Stolen?
Distribution transformers are stolen because they combine high scrap value with almost no security, since a single unit holds tens of kilograms of copper, sits outdoors with no attendant, may be inspected only once a month, and stands within reach of any road, so a prepared crew can strip it and be gone before anyone knows. The conditions that make these units good at their job are exactly the conditions a thief wants.
The scrap price does the rest. Copper has traded near record levels through 2025 and 2026 on demand from electrification, grid expansion and renewables. Scrap yards remain the weak link in enforcement even where licensing rules exist. Organised crews treat a rural feeder as a route with several paydays on it: a pad-mounted unit, a pole-mounted unit, the earthing strip, and the LV cable on the way out. Opportunistic theft also happens, but utilities report repeat visits to the same district most often.
Two secondary motives complete the picture. In some regions, units are taken for reuse in informal settlements or for unauthorised connections rather than for scrap. Elsewhere, oil is drained and sold, which ruins the insulation system even though no metal is taken. The main transformer theft causes therefore reduce to one material and two conditions: copper that pays, sites that hide the work, and markets that accept the material.
Transformer Copper Theft: The Driver Behind the Numbers
Copper is the reason the crime pays, and the copper price chart explains the incident chart, because copper traded near record highs through 2025 and 2026 on demand from electrification, grid expansion and renewables, while the distribution network offers the metal in unguarded, road-accessible packages. The windings inside one unit can weigh from tens to over a hundred kilograms depending on the rating. Earthing conductors and LV cable add more.
The repair asymmetry makes the crime expensive for operators. A CenterPoint Energy safety summary, citing a Department of Energy estimate, reports that copper wire theft costs the United States nearly $1 billion per year and that stealing just $100 of copper wire can cost a utility up to $5,000 to repair (retrieved 4 October 2026). The same asymmetry applies to transformers. The scrap value taken is a small fraction of the replacement, crane hire, outage and engineering costs that follow.
Enforcement improves slowly. Scrap-metal licensing and dealer reporting rules now exist in most jurisdictions, and utilities mark components for tracing. None of it changes the calculation on a dark rural road at 2 a.m. That is why detection and response time, covered later in this guide, carry so much weight in the total loss.
What Parts of a Distribution Transformer Are Commonly Targeted?
The parts of distribution transformer commonly targeted follow a consistent order: exposed copper first, fittings second, and the windings only when there is time to open the tank, a preference that field inspections after theft events across several regions show is driven by scrap value per minute of work. The table lists each part with the reason it is taken and the signature it leaves.
| Part targeted | Why it is taken | How it is removed | Signature left on the network |
|---|---|---|---|
| Earthing conductors and strips | Exposed copper, no tank entry needed | Cut at the pole base or pad | Lost earthing; raised touch voltage; often found weeks later |
| LV cables and neutrals | Copper along low-voltage runs | Cut along the span | Outage or unbalanced phases on the feeder |
| Bushings and connectors | Brass and copper on the tank | Unbolted or broken off | Unit cannot be reconnected safely; oil seepage |
| Cooling radiators and panels | Steel and copper value; access to windings | Torn or unfastened | Tank breach; oil loss; visible damage |
| Copper windings | Highest value per kilogram | Tank opened, windings pulled | Oil spill; total unit loss in most cases |
| Oil | Resale value in some markets | Valve opened, drained into containers | Insulation ruined; unit written off |
| Metering and control boxes | Small copper and electronics | Unbolted in minutes | Loss of measurement; billing data gaps |
The protection consequence follows from the list. The parts most often stolen sit outside the tank, so a strategy that only guards the tank door misses most events. The pages on tilt and movement detection and vibration based theft detection cover the signatures that tank-side tampering produces.
Where Does the Risk Concentrate?
Theft concentrates where three conditions meet at the same site: a valuable unit, no honest witnesses nearby, and a fast exit route. Because all three can be scored for every feeder on your map, location risk is the cheapest and most useful input in a prevention programme. The settings below recur in utility loss reports across markets.
| Setting | Why it is hit hardest | Typical inspection gap |
|---|---|---|
| Rural distribution feeders | Scattered load points, long runs, light traffic at night | Weeks to a month |
| Agricultural and irrigation sites | Seasonal loads sit idle and unwatched for months | Seasonal |
| Regions with organised infrastructure theft | Crews work districts systematically | Varies; repeat hits common |
| Pole-mounted units on long lines | Ladders and lifting gear defeat height | Monthly at best |
| Construction sites and new subdivisions | Energised but unoccupied before handover | Days to weeks |
| Villages at feeder ends | Long police response; informal scrap sellers nearby | Weekly to monthly |
The first row dominates most loss statistics, and the dedicated page on rural transformer theft prevention covers that setting in depth. Regional campaigns, such as those documented in theft patterns across African networks, show how organised the problem becomes when enforcement is weak. The checklist for protecting pole-mounted transformers reflects the reality that height alone no longer deters a crew with a ladder.
Turning the table into a watch list is the first practical step in any programme. Score each district for incident history, access roads and inspection gap, then rank the units. Hardware comes after the list exists.
How Are Transformers Stolen? Five Methods and Their Signatures
Crews use five documented methods, and each one leaves a signature that a monitoring system or a field inspection can recognise, so reading your incident history against the list below usually shows which method dominates your district and determines which countermeasure pays for itself first. The table summarises the five, and the notes that follow add field detail.
| Method | What the crew does | Time on site | Signature |
|---|---|---|---|
| Enclosure opened for copper | LV door or tank panel forced; reachable copper cut out | 5–15 min | Vibration then door-state event in quick succession |
| Connections cut in advance | Earthing strips and LV cables cut days before the main event | Minutes per cut | Repeated isolated cable faults along one feeder |
| Whole-unit removal | Unit lifted onto a truck or trailer with crane or hiab; the costliest form of distribution transformer theft | 10–20 min | Sudden total loss; ground disturbance at the pad |
| Oil draining | Valve opened; oil pumped into containers | 15–40 min | Slow level drop; unit found ruined, not removed |
| Back-feed enabled tampering | Work done while secondary generation keeps the unit live | Varies | Events with feeder switched out; safety risk to crews |
Whole-unit removal is the costliest form of distribution transformer theft for the operator, because the asset, the oil containment and the connection hardware all go at once and the site may need civil works before a replacement can be set. The other four methods damage the unit in place, which keeps outage scope smaller but multiplies the number of incidents to process.
Two patterns run across all five. The work happens in minutes, so monthly inspection cycles discover events long after the fact. And the electrical signatures (vibration, door state, cable continuity, sudden load loss) are exactly what a monitoring system watches. A safety note belongs here: where secondary generation exists, the site must be treated as live even after the feeder is switched out, because back-feed has injured thieves and lineworkers alike.
What Are the Consequences?
The metal is the smallest part of the loss, because a single event interrupts supply to every customer on the unit, triggers repair costs several times the scrap value taken, creates safety hazards that outlast the incident, and distorts planning data for months afterwards. The table separates the four cost groups so a budget case can be built on them.
| Cost group | What it includes | Who pays it |
|---|---|---|
| Supply interruption | Outage for a village, clinic cold chain, irrigation scheme | Customers; utility penalties |
| Repair and replacement | Unit price, crane, crew, oil disposal, adjacent-unit reinspection | Utility capital and O&M |
| Safety and compliance | Electrocution and fire risk; degraded protection coordination | Utility; public |
| Data and planning | Spares distortion, regulatory indicators, insurance pressure | Utility; ratepayers |
Transformer theft statistics deserve a careful read, with source and date attached. As of 2026, the most defensible public figures remain the U.S. Department of Energy estimate of nearly $1 billion per year in copper theft costs, carried by utility pages such as CenterPoint Energy’s, together with the FBI’s long-standing classification of metal theft as a threat to critical infrastructure. Jurisdiction-level numbers for distribution transformer theft specifically are published unevenly. Treat any single dramatic figure, from any vendor including this site’s competitors, as needing the same check: source, year, method, sample.
[PERSONAL EXPERIENCE] Across commissioning work from 2024 to 2026, the teams we support reached the same conclusion in fewer words: the incident you can verify beats the number you cannot. That is why the prevention section below starts from your own feeder map, not from imported statistics.
Limitations: What a General Guide Can and Cannot Tell You
A general guide has honest limits, and stating them prevents bad procurement decisions, because the statistics above come from specific jurisdictions and years, the methods vary by region, and no measure works without a response chain behind it. Treat the three limitations below as design constraints rather than footnotes.
1. The published numbers do not describe your district. The $1 billion Department of Energy figure covers copper theft across sectors. It sizes the material problem; it does not tell you your incident rate. For that, your own outage and inspection records are the only honest source.
2. Regional variation is real, so imported measures may not transfer. Scrap licensing, enforcement and resale markets differ by country. Marked components and dealer reporting work in some markets and do almost nothing where informal scrap buying is tolerated. Check which of the five methods dominates locally before buying anything.
3. Monitoring cannot act by itself. A siren interrupts a crew. A report reaches an operator in seconds. But if nobody is staffed to act, both decay into noise, and an unanswered alarm trains the whole district to ignore the next one. Programs that cannot fund the response chain should harden sites physically and raise inspection frequency instead; the page on how a transformer anti-theft monitoring system works explains what a working chain looks like.
How Can Utilities Prevent It? Two Layers, One Sequence
Prevention works as two layers with different jobs, in which physical measures make the attempt slower and noisier, while monitoring and alarm response shorten the time between the attempt and a human decision, and neither layer replaces the other, as any utility that has run both within one budget year can confirm. The sequence below turns that principle into an order of work.
| Layer | What it does | Where it fits |
|---|---|---|
| Physical hardening | Anti-theft bolts, locked enclosures, anchoring, concealed earthing, fencing and lighting | First, on the highest-risk units from the watch list |
| Local deterrence | Siren and strobe on verified events | With monitoring, where a crew must be interrupted on site |
| Remote monitoring | Sensors watch the five method signatures; alarms reach an operator in seconds | Where the response chain exists to act |
| Process | Quarterly alarm-history review; thresholds tuned per site | Continuous |
The detailed catalogue of physical measures is on the page how to prevent transformer theft. The equipment that implements the monitoring layer is the transformer anti-theft monitoring device (HF-T-601), which bundles the sensors with GSM/4G/NB-IoT reporting for unstaffed sites.
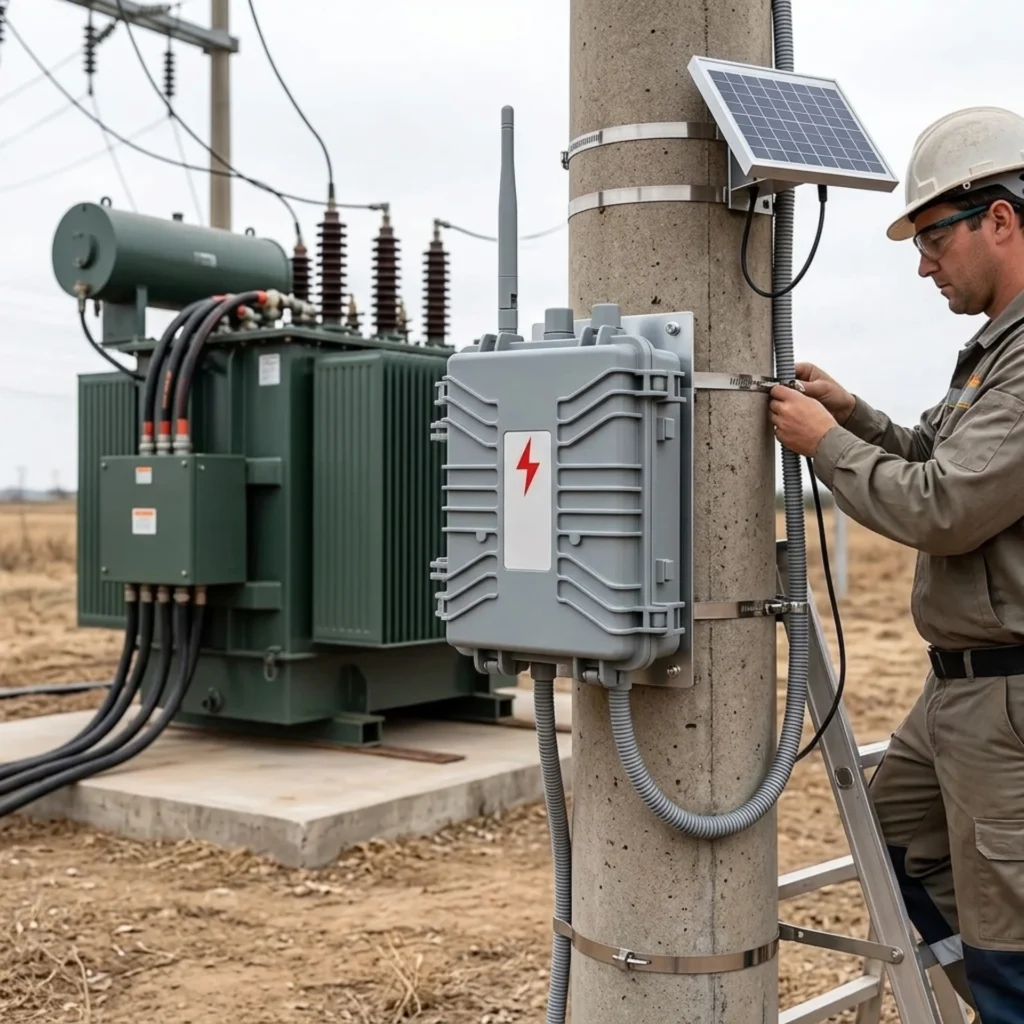
Figure 1: Pole-mounted installation of a monitoring terminal with solar supply, the typical configuration for unstaffed rural units.
[UNIQUE INSIGHT] Utilities that skip the response-chain step end up with alarms nobody answers, and an unanswered alarm trains everyone to ignore the next one. Start from the risk map, harden the top units, then add monitoring where a dispatch decision can actually follow the alarm. If you are specifying monitoring for unstaffed units, request the HF-T-601 datasheet with a per-site configuration checklist, or book an engineer call to map the sequence above against your district list.
Frequently Asked Questions About Distribution Transformer Theft
What parts of a distribution transformer are stolen most often? Earthing conductors and LV cables first, because they are exposed copper that needs no tank entry. Bushings, connectors and cooling panels follow. The copper windings are taken when the crew has time to open the tank, or the whole unit is removed and stripped elsewhere.
Where does the theft of distribution transformers happen most? On rural feeders, at agricultural and irrigation installations, on long pole-mounted lines, at construction sites between commissioning and handover, and in regions with organised infrastructure theft. The common factors are value, absence of people nearby, and a fast exit route.
How are distribution transformers stolen? Five documented methods: opening the enclosure for copper, cutting connections in advance, lifting the whole unit with a crane vehicle, draining the oil for resale, and tampering that exploits back-feed from secondary generation. Each leaves a distinct electrical or physical signature.
What are the consequences of transformer theft? Immediate power loss for the customers on that unit, repair costs that dwarf the scrap value taken, safety risks from open tanks and lost earthing, and slower harms: distorted spares planning, worse regulatory indicators, and insurance pressure in repeat-incident districts.
How quickly should a utility respond to a suspected theft event? In minutes. The value of any detection is set by the response chain behind it: a local alarm interrupts the crew on site, and a verified report converts an inspection cycle of weeks into a dispatch decision in seconds. Programs that cannot staff the response should harden the site physically and set inspection frequency to match the district’s incident history.
Conclusion and References
Distribution transformer theft is a planned, material-driven crime that concentrates exactly where networks are hardest to watch: rural feeders, agricultural loads, long pole-mounted lines. The metal taken is worth a fraction of what the event costs in outage, repair, safety and planning damage, so the correct unit of account is the incident, not the copper. Read the five methods against your own feeder map, apply physical measures to the highest-risk units, and put monitoring with a working response chain behind them. The crime then becomes an event you answer in minutes instead of a loss you discover at the next inspection.
References
- CenterPoint Energy, Electrical Wire Theft safety page; carries the U.S. Department of Energy estimate that copper theft costs the United States nearly $1 billion per year, with $100 of stolen copper costing up to $5,000 to repair. official page (retrieved 4 October 2026).
- U.S. Department of Energy, copper theft cost estimate as carried by utility safety pages (text citation).
- IEC 60076-1:2011, Power transformers — Part 1: General, IEC TC 14; rating context for the units discussed (text citation).
- IEC 60529:1989+AMD1:1999+AMD2:2013 (the IP code), IEC TC 2; enclosure protection context for outdoor equipment (text citation).
Written by the engineering content team at Baoding Houfeng Trading Co., Ltd., works with utilities, EPC contractors and industrial operators on transformer monitoring and protection projects. Technically reviewed by [Reviewer name], senior protection and metering engineer, [X] years in distribution network operations (to be confirmed by the client). Last updated: 4 October 2026.