

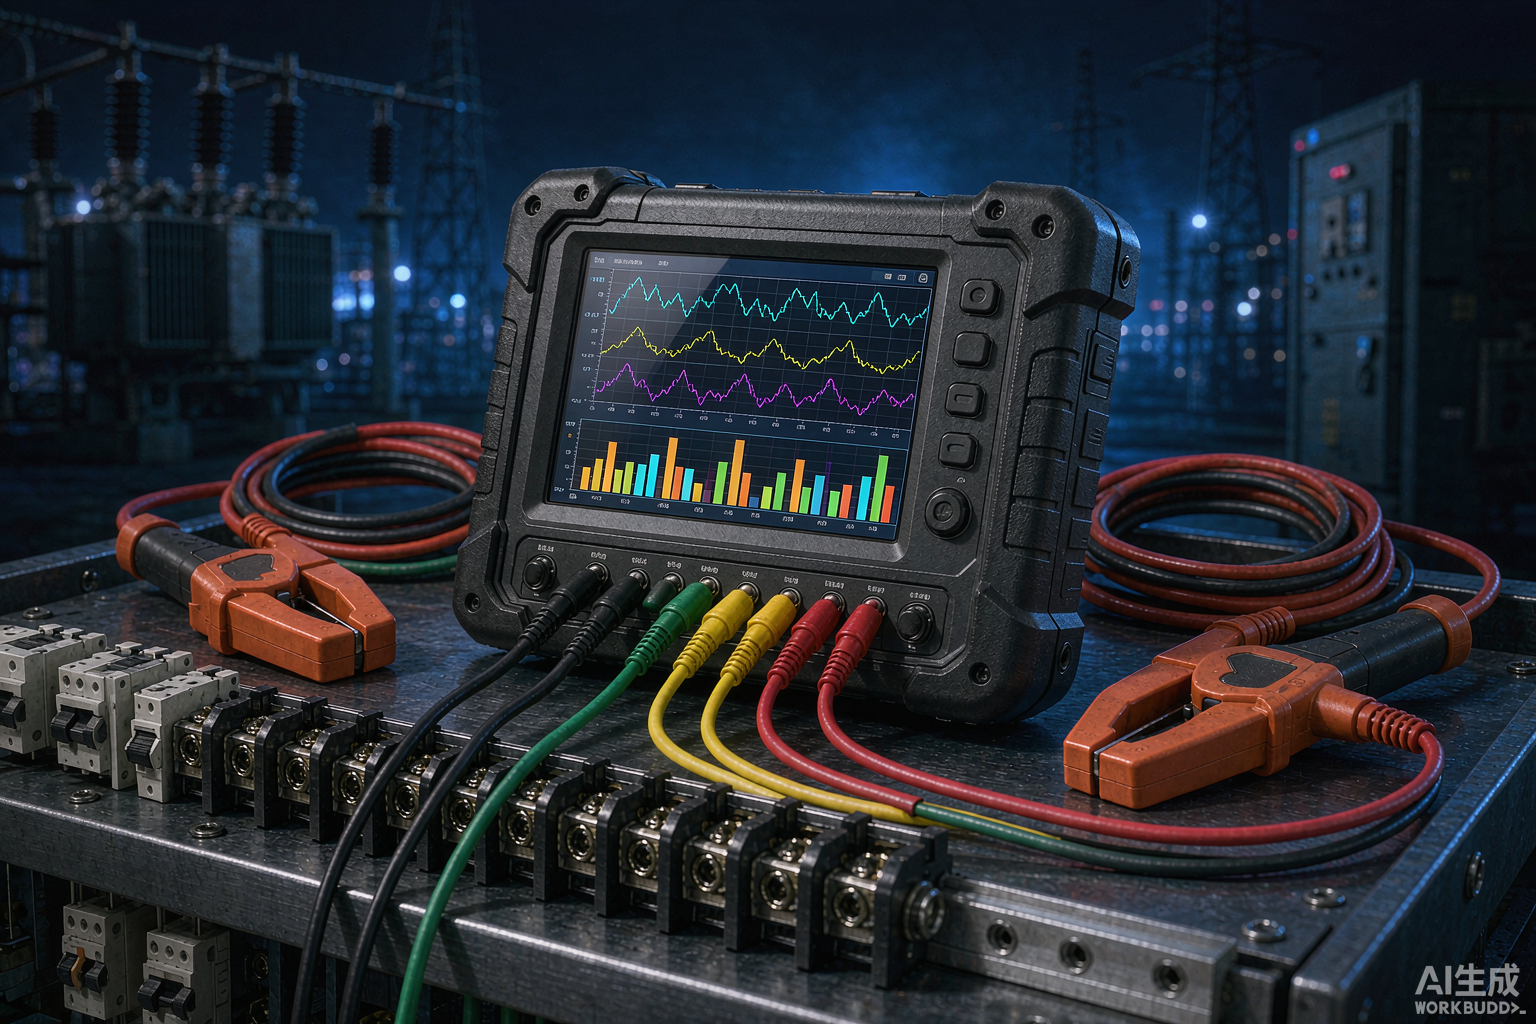
A power quality analyzer is an instrument that measures, aggregates and records the voltage and current characteristics of an AC supply against a defined set of methods, so that a flicker complaint, a nuisance trip or a harmonic penalty can be turned into a number that a utility and a plant will both accept. The distinction that decides most purchases is not the size of the display or the number of parameters in the brochure; it is whether the measurement method, the aggregation intervals and the time reference are good enough for the result to survive a dispute.
Author: Leon Zhang — Power monitoring and testing equipment team, Baoding Houfeng Trading Co., Ltd., specifying power quality instruments for plants, utilities and commissioning contractors
Technical review: this guide passed editorial review and was checked against IEC 61000-4-30:2025, IEC 62586-2:2017 and EN 50160:2022 before publication
Last updated: 22 October 2026
Key takeaways
- Class is the first specification to fix, not the last. Class A meters the method in IEC 61000-4-30:2025 without gaps and on a synchronised clock, which is why only Class A results are accepted for contractual and compliance work; a Class S instrument is cheaper and entirely adequate for a survey that your own engineers will act on.
- A power quality analyzer is bought for one of four jobs: a spot check, a complaint investigation, a compliance campaign or permanent monitoring. Each job needs a different combination of channel count, memory, power supply and enclosure, and paying for the wrong one is the most common waste.
- The aggregation interval is part of the measurement, not a reporting preference. Ten-cycle, 150-cycle, 10-minute and 2-hour values answer different questions, and an instrument that only logs one-minute averages cannot be used to demonstrate compliance with a ten-minute limit.
- A power quality meter is only as good as its transducers. A 0.1% voltage channel fed through a 1% clamp is a 1% instrument (IEC 61000-4-30:2025), and the clamp ratio has to be entered into the instrument rather than applied later in a spreadsheet.
- Harmonic problems are rarely solved by looking at total distortion alone. The order matters: triplen harmonics add in the neutral, the fifth and seventh dominate drive loads, and the frequency of a resonance decides whether a capacitor bank will amplify rather than filter.
- Long-term monitoring fails on logistics far more often than on electronics: no supply at the point, a flat battery, a lost USB stick or a clock that drifted. Plan the power, the memory and the time reference before the installation day.
Introduction
A plant that has just paid a harmonic penalty, or a utility that has just been handed a flicker complaint with a photograph of dimming lamps, is usually asked to prove the disturbance happened, which requires an instrument that records the right quantity over the right interval with the right clock and produces a file a third party can read. That is the job this guide is written around.
This guide is written for the engineer who has to specify that instrument and then defend what it recorded. It covers the measurement quantities and how they are aggregated, the difference between the accuracy classes and when each one is required, the practical selection of channels, clamps and memory for the four common jobs, the wiring and verification routine that prevents a fortnight of data being thrown away, the interpretation of harmonics, unbalance and flicker, and the limits of what a portable instrument can and cannot tell you. Selection tables are written in the form a procurement engineer can send to a supplier, and every threshold quoted here is traceable to a published clause.
What a power quality analyzer measures
A power quality analyzer measures the supply in defined windows on a defined time reference rather than continuously and approximately, which is what makes its output comparable between instruments and defensible between parties. IEC 61000-4-30:2025 lists the parameters a compliant instrument has to cover: power frequency, magnitude of the supply voltage, flicker, dips and swells, interruptions, transient voltages, unbalance, voltage harmonics and interharmonics, rapid voltage changes, mains signalling voltages, and the corresponding current quantities.
The list matters because most of the meters sold as power quality instruments measure a subset of it and present the subset as if it were the whole. A hand-held unit that reports voltage, current, power, power factor and a total harmonic distortion figure is a useful load analyser. It is not a power quality instrument in the sense the standard uses the term, because it has no defined aggregation, no event detection and no way to demonstrate that the values it prints will agree with the values another instrument would print on the same supply.
The second thing the instrument does is classify time. A disturbance lasting 200 ms and a slow drift lasting a week are both deviations from nominal, but they are different phenomena with different causes and different remedies. The instrument therefore keeps two parallel records: aggregated values on a fixed interval ladder, and discrete events with their own start time, duration and characteristic magnitude. Choosing one is largely a question of how honestly it keeps both.
The aggregation ladder
| Aggregation interval | Built from | What it is used for |
|---|---|---|
| 10 cycles (about 200 ms at 50 Hz) | Half-cycle or full-cycle RMS | The basic building block for dips, swells and interruptions |
| 150 cycles (about 3 s at 50 Hz) | Fifteen consecutive 10-cycle values | Intermediate aggregation, flicker and rapid voltage change |
| 10 minutes | 150-cycle values, on an absolute clock | The interval EN 50160:2022 applies to voltage magnitude, unbalance and harmonics |
| 2 hours | Twelve consecutive 10-minute values | Long-term flicker and slow trend reporting |
Nothing in that ladder is arbitrary. Ten minutes is the interval a European supply contract is written against, so an instrument that produces five-minute averages cannot be used to demonstrate compliance with a ten-minute limit without re-deriving the value, which defeats the purpose of buying a compliant meter.
Steady values and events are different data
The distinction that catches people out is that the two records live at different time resolutions and are read differently. A ten-minute mean voltage that sits comfortably inside its band can hide a 40 ms dip deep enough to reset a drive, because the dip contributes almost nothing to the mean. The reverse error is equally common: an event log full of swells on a lightly loaded feeder looks alarming until the same period’s ten-minute values show the voltage was riding at the top of its band the whole time and the swells were switching transients on top of an already high supply. Neither record alone tells the story, and an instrument that forces you to choose between them is the wrong instrument.
Class A and class s: which accuracy class you actually need
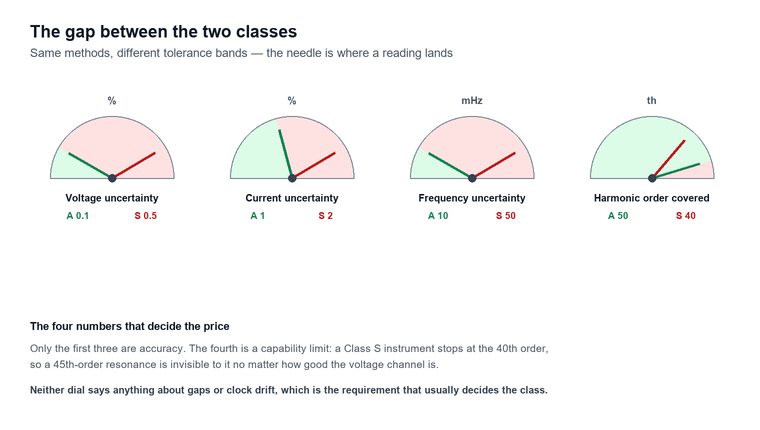
Class A and Class S use the same measurement methods but accept different uncertainties, and the difference is written into IEC 61000-4-30:2025 Clause 4 rather than left to the discretion of the manufacturer, which is why the class should be fixed before any other specification is discussed. For voltage, Class A holds uncertainty within 0.1% of the declared input voltage where Class S allows 0.5% (IEC 61000-4-30:2025); for current the pair is 1% and 2%; for frequency the pair is 10 mHz and 50 mHz; and the harmonic order covered is the 50th against the 40th (IEC 61000-4-30:2025 Clause 4).
The requirements that separate the classes most sharply are not accuracy figures at all. Class A has to aggregate without gaps and stay synchronised to a time reference, with a clock uncertainty of one second per 24 hours and a defined route to re-synchronisation; Class S may leave gaps between aggregations and is not required to synchronise. That single difference explains the cost gap, and it also explains why a Class A instrument is the only defensible choice when the output will be read by a third party.
| Requirement | Class A, advanced | Class S, surveys |
|---|---|---|
| Voltage uncertainty | 0.1% of declared input | 0.5% of declared input |
| Current uncertainty | 1% | 2% |
| Frequency uncertainty | 10 mHz | 50 mHz |
| RMS calculation step | Half-cycle | One cycle |
| 150-cycle aggregation | No gaps, synchronised to an absolute clock | Gaps permitted |
| Harmonic order covered | 50th | 40th |
| Clock drift per 24 hours | 1 second | 5 seconds |
| Time synchronisation | GPS, radio or network timing | Not required |
Every figure in that table is quoted from IEC 61000-4-30:2025 Clause 4 rather than from a manufacturer datasheet, which is why two compliant instruments agree even when the logo on the front does not.
When a Class S instrument is the right purchase
A Class S meter is not a compromise for every buyer. If the question is whether a new drive installation has made the voltage distortion on a plant busbar worse, and the answer will be acted on by the plant’s own engineers, a Class S recorder with a competent clamp set gives an answer that is both cheaper and easier to defend than a Class A instrument whose extra capability nobody will use. The change of mind comes when the data crosses the fence: a utility penalty notice, a contract with a supply quality schedule, a customer complaint heading for litigation or a grid-connection acceptance test. At that point the uncertainty budget and the time stamp become the subject of the argument, and Class S stops being adequate.
The practical rule is to buy Class A when the output will be signed by one party and challenged by another, and to buy Class S when the output is an internal engineering input. Buying Class A for every job is a common and expensive habit; buying Class S for a compliance campaign is a mistake that only becomes visible when the report is rejected.
Channels, clamps and sampling: reading the specification sheet
The specification sheet of a power quality meter is usually dominated by headline numbers that matter far less than three boring ones, which are the channel count, the input range and the sampling rate, and those three decide whether the instrument can answer the question at all. Channels come in pairs and the pairs are not interchangeable. Three voltage and three current channels cover a three-phase four-wire circuit; a fourth current channel is needed to measure neutral current directly, which for a four-wire distribution board carrying triplen harmonics is often the most interesting channel on the instrument.
Input range is where the clamp decision is made. A voltage input that covers 20 V to 900 V handles low voltage distribution directly and reaches the upper end of a 690 V system, but it cannot be connected to a medium voltage circuit without voltage transformers, and the transformer ratio then has to be entered into the instrument so that the displayed values refer to the primary. The same applies to current: a clamp rated 0 to 200 A is a distribution board instrument, a 1000 A or 2000 A clamp is a feeder instrument, and a flexible Rogowski coil is the only practical choice for a busbar or a cable tray where no clamp will fit.
Sampling rate sets the ceiling on what can be seen at all. An instrument sampling synchronously at 12.8 kHz on a 50 Hz supply sees 256 points per cycle, which resolves the 50th harmonic with margin (IEC 61000-4-7:2002); a unit sampling at 1 kHz sees 20 points per cycle and can report a 5th harmonic but cannot resolve a 40th without aliasing. For transient capture, the requirement is different again, because a 1 ms transient is not a harmonic at all and needs a sampling rate and a trigger, not a spectrum analyser.
| Specification | Why it decides the purchase | What to check before ordering |
|---|---|---|
| Voltage channels | Determines whether neutral-to-earth and three-phase-to-neutral are both measurable | Three channels for 3P3W, four for 3P4W with neutral |
| Current channels | Neutral current is the fourth channel nobody orders | Confirm a fourth clamp input exists, not just a fourth terminal |
| Voltage range | Must cover the highest system voltage without a VT, or a VT ratio must be entered | 0 to 800 V or 20 to 900 V covers LV directly |
| Current range and clamp type | A clamp that cannot fit the conductor makes the instrument useless | 5 A/25 A clamp for secondary circuits, 1000 A for feeders, Rogowski for busbars |
| Sampling rate | Sets the highest harmonic that can be measured honestly | At least 12.8 kHz synchronous for 50th order |
| Transient capability | Dips are not transients, and a mean cannot see a 1 ms event | Peak capture and a defined trigger threshold |
| Memory and interval | Sets the recording duration at the chosen aggregation | 1-minute interval for 18 months is a different instrument class |
| Power supply | No socket at the metering point is the normal case | Battery runtime plus a circuit-powered option |
| Clock and synchronisation | Decides whether the time stamp survives a dispute | GPS or network timing for Class A work |
The product range behind this section illustrates the spread. The handheld unit covers 0 to 800 V with automatic range switching on three voltage and three current channels, reads phase angle over 0 to 359.99°, resolves harmonics to the 63rd and stores over 18 months at a one-minute interval on a 2 kg frame with an 8-hour battery. The portable power quality meter covers 20 to 900 V, resolves harmonics from the 2nd to the 63rd and uses a 2000 V isolation module on the voltage input, which is a different answer to the same question. Neither is better in the abstract; they are different instruments for different jobs, and the rest of this guide is about telling them apart.
Spot check, investigation, compliance campaign or permanent monitoring
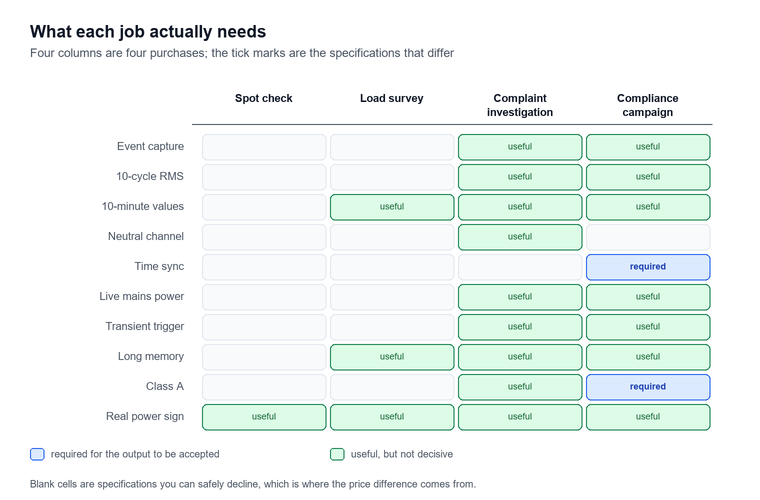
The four jobs a power quality meter is bought for are separated by how long the instrument stays connected and by who reads the result, and the practical specification follows from those two facts far more directly than from any accuracy figure on the datasheet. A spot check lasts minutes and is read by the person holding the instrument. A complaint investigation lasts days and is read by whoever has to answer the complaint. A compliance campaign lasts a week or more and is read against a contractual or regulatory limit. Permanent monitoring lasts years and is read by a system rather than a person.
Duration drives memory and power. An investigation that must catch an intermittent event needs a recording interval short enough to bound the event in time and a buffer long enough to hold a week of it, plus a power arrangement that survives a week without attention. A compliance campaign needs the opposite emphasis: a long, gap-free record at ten-minute aggregation, a clock that does not drift, and a file format that the compliance software will accept without conversion.
Matching the instrument to the job
| power quality analyzer job | Typical duration | Recording interval | Class needed | What has to be specified |
|---|---|---|---|---|
| Spot check at a panel | 10 minutes | None, manual readings | Any | A true RMS meter with a phase-angle display is enough |
| Load survey before adding a drive | 1 to 4 weeks | 1 to 10 minutes | Class S | Ranges that cover expected and inrush current |
| Complaint investigation | 1 day to 2 weeks | 10 cycles for events, 10 minutes for values | Class A | Event triggers, pre-trigger capture, neutral channel |
| Compliance campaign | 1 week minimum | 10 minutes, gap-free | Class A | Time synchronisation, declared input voltage, file format |
| Permanent monitoring | Years | 10 minutes plus events | Class A | Panel mounting, continuous supply, communications |
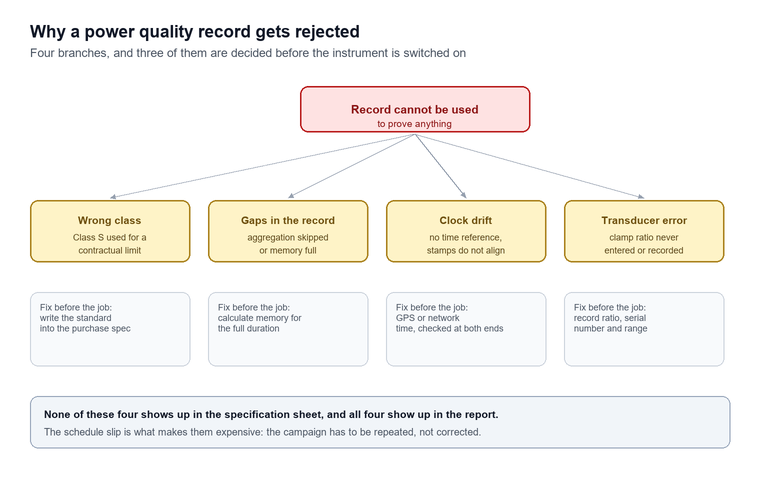
The fourth row is where most disappointments originate. A compliance campaign against a ten-minute limit needs a gap-free record (IEC 61000-4-30:2025), and gaps appear for reasons that have nothing to do with the instrument’s accuracy: an aggregation that is skipped while the processor writes to memory, a clock resynchronisation that reorders two samples, a memory card that fills in the middle of the week. None of these shows up in the specification sheet, and all of them show up in the report.
A complaint investigation, worked through
A packaging line trips two or three times a week, always in the late afternoon, and the maintenance team has replaced the contactor twice without effect. The sequence that produces an answer runs as follows.
- Establish the symptom in electrical terms. If the line stops and restarts without a manual reset, the cause is more likely a contactor drop-out than a drive fault, which points at the control supply voltage rather than at the power circuit.
- Connect the instrument at the point of common coupling for the line, not at the incoming board, so that the measurement sees what the line sees.
- Set event thresholds at nine-tenths and 110% of nominal with a 10-cycle window (IEC 61000-4-30:2025), and enable pre-trigger capture of at least one second.
- Leave the instrument for a full production week so that the late-afternoon pattern has a chance to repeat at least three times.
- Read the event log first and the ten-minute values second, then check whether the two records agree about when the disturbance started.
- Compare the event timestamps against the plant’s own records: a compressor start, a capacitor bank switching in, a welding shop on the same feeder.
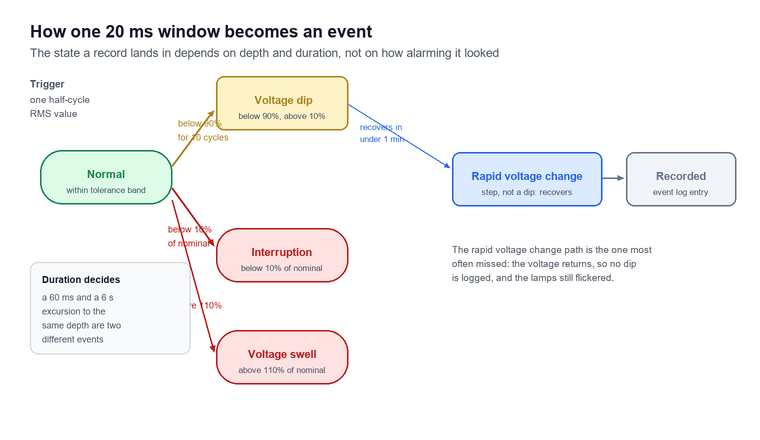
For example, a run of three dips to 78% of nominal lasting 60 ms (IEC 61000-4-30:2025 event definition), all occurring within two minutes of 16:20 on three different days, with no corresponding movement in the ten-minute mean, points to a switching event on the same feeder rather than to a supply problem. The remedy is a small reactor, a different switching sequence or ride-through on the control supply, and the measurement has paid for itself by eliminating the contactor.
Wiring, phase sequence and the verification routine
Almost every bad power quality dataset can be traced to the wiring rather than to the instrument, and almost every wiring error is visible in the first two minutes if anyone actually looks at the display instead of walking away. The routine that prevents it has four steps, and it costs about ten minutes at the start of a job that may run for two weeks.
Before connecting anything, record the circuit: the nominal voltage, the transformer connection, whether the neutral is distributed, which conductor is which colour, and the current range of each clamp. After connecting, verify the phase sequence on the vector diagram that most instruments display. A three-phase four-wire connection with one phase reversed shows up immediately as a phase-angle spread of 120°, 60° and 180° instead of three values 120° apart, and an instrument that reports a negative real power on a load that is obviously consuming is telling you the clamp is reversed.
The four-step check before leaving site
- Voltage and phase sequence. Confirm three voltages of roughly equal magnitude and three phase angles separated by 120°, with the expected rotation.
- Power sign and magnitude. Confirm that real power is positive and roughly equal to the expected load; a negative reading on one phase means a reversed clamp.
- Harmonic sanity. Look at the second harmonic with no obvious source. A second harmonic above about 2% on a three-phase system (IEC 61000-4-30:2025) usually indicates a DC offset from a saturated transducer or a wiring error rather than a real load condition.
- Clock and memory. Confirm the clock against a reference, confirm the recording interval, and confirm that free memory covers the full duration with a margin.
The clamp ratio is the step that is most often skipped and most expensive to correct afterwards. If a 1000 A clamp is set on the instrument as a 100 A clamp, every current, power and harmonic current value is wrong by a factor of ten, and no amount of post-processing recovers the correct number unless the ratio was recorded on the job sheet. Writing the ratio, the clamp serial number and the range on the installation record takes one line and saves the whole campaign.
Harmonics: order, resonance and the neutral
Harmonics are the part of power quality where the summary number and the diagnosis diverge most sharply, because a total harmonic distortion figure of 6% (IEC 61000-4-7:2002) can describe two completely different situations. A distorted current drawn by a drive cluster and a distorted voltage caused by a resonance with a capacitor bank produce the same total number and need opposite responses (IEC 61000-4-7:2002).
Total harmonic distortion is the root of the sum of the squares of the harmonic components divided by the fundamental, expressed as a percentage, and it is a magnitude without a direction: it says how much distortion exists and nothing about which order produces it. IEC 61000-4-7:2002 defines how the components are grouped and how the value is calculated, and an instrument that computes it from a different grouping produces a number that is close but not comparable.
The order is what carries the diagnosis. Triplen harmonics, the third, ninth and fifteenth, are in phase in all three phases of a four-wire system and therefore add in the neutral instead of cancelling, which is why a neutral conductor sized for the fundamental can carry more current than any phase. The fifth and seventh dominate the current drawn by a six-pulse rectifier. Higher orders point towards switching frequencies and towards resonance with power factor correction capacitors, where a modest harmonic current can produce a large harmonic voltage because the impedance at that order is high.
The resonance order is the harmonic order at which the parallel combination of the supply inductance and the connected capacitance presents its highest impedance, and it is estimated as the square root of the short-circuit power at the busbar divided by the capacitor bank rating. A 1 000 kVA transformer with 6% impedance feeding a 300 kvar bank resonates somewhere between the 5th and the 7th, which is exactly where a six-pulse drive puts most of its current.
Figure 4. The same drive, before and after. A reactor does not remove the fifth and seventh, it moves the resonance away from them, which is why the spectrum rather than the total is the specification.
That distinction has a procurement consequence. An instrument that reports individual harmonic magnitudes to the 50th order, with phase, lets an engineer compute whether a proposed capacitor bank will resonate; an instrument that reports only total distortion does not. For a plant with power factor correction, the individual spectrum is not a luxury feature.
Unbalance and negative sequence: the motor heating question
Voltage unbalance is the one power quality parameter whose damage mechanism is easiest to state and hardest to believe. A small negative-sequence voltage produces a large negative-sequence current in an induction motor, because the rotor’s slip with respect to the reverse field is close to 2, and the resulting rotor heating is roughly proportional to the square of that current. The motor derating that follows is why a supply that looks acceptable on a voltmeter can still be the reason a motor fails every eighteen months.
The voltage unbalance factor is the ratio of the negative-sequence component to the positive-sequence component, expressed as a percentage, and it is the definition that EN 50160:2022 and most supply contracts use. Its companion, the current unbalance factor, is computed the same way from the three currents and is the quantity a plant can act on directly, because it points at a load distribution problem on a four-wire board rather than at the supply.
EN 50160:2022 sets the limit at 2% for 95% of a week (EN 50160:2022), measured as ten-minute mean values of the negative-sequence component divided by the positive-sequence component, with some areas permitting 3% where single-phase or two-phase lines are common (CEER benchmarking report, 2024). The measurement detail matters: a 2% limit applied to ten-minute means is a very different requirement from a 2% limit applied to instantaneous samples (EN 50160:2022), and an instrument that reports only instantaneous unbalance will show values that appear to breach a limit the supply actually meets.
| Unbalance factor | Typical source | Consequence for a motor |
|---|---|---|
| Below 1% | Balanced supply, evenly distributed single-phase load | No derating required |
| 1% to 2% | Uneven single-phase load on a four-wire board | Slight temperature rise, within design margin |
| 2% to 3% | Poor load distribution, or a supply at the permitted edge | Derating needed, check the manufacturer’s curve |
| Above 3% | Broken conductor, single-phasing, large single-phase load | Stop and investigate before running the motor |
A dedicated instrument earns its place where the question is only unbalance. A three-phase current unbalance analyzer records three phase currents plus neutral zero-sequence current around the clock, computes the unbalance degree continuously, holds three years of history on a USB stick and runs on 85 to 265 V with a recording interval settable from 1 to 99 minutes. For a distribution transformer whose loading drifts between phases as customers are added, that is a better fit than a full power quality analyzer, because the question is narrow and the monitoring period is long.
Figure 3. Two axes separate the causes. Unbalance that appears in both voltage and current comes from the load; unbalance that appears in voltage alone comes from the supply, and the two need different conversations.
Flicker, dips and the events a mean cannot see
Flicker is the parameter most often measured and least often interpreted, because it is defined in terms of human perception rather than in volts. A short-term flicker value is produced by a weighting filter that models the eye’s response to lamp luminance change, integrated over ten minutes (IEC 61000-4-15:2010), and a long-term value is aggregated from twelve consecutive short-term values over two hours. EN 50160:2022 sets the long-term limit at 1 for 95% of a week (EN 50160:2022).
The consequence is that a flicker reading cannot be converted into a voltage modulation depth without knowing the modulation frequency, and a plant that asks “how much voltage fluctuation is allowed” is asking a question the standard answers only through the perception model. What the instrument reports is the quantity the limit is written against, and that is the useful thing to record.
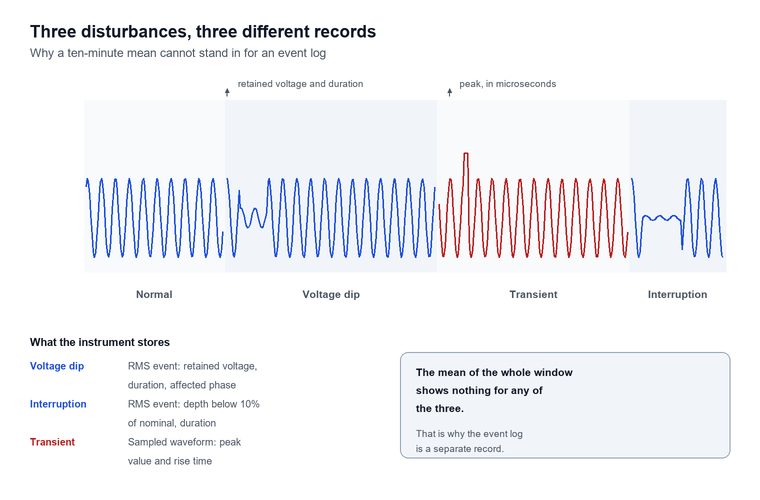
Dips are the opposite: entirely physical, and the parameter that costs the most money. A voltage dip is a reduction in RMS voltage below a threshold, characterised by its retained voltage and its duration, and a short interruption is a dip to below 10% of nominal. The distinction between a dip and an interruption is one of depth, and the distinction between either and a transient is one of duration: a transient lasts microseconds to milliseconds and is captured as a waveform, while a dip lasts from half a cycle to a minute and is captured as an RMS event.
Why momentary events dominate the cost
The economics explain why event capture is worth paying for. A study prepared for the U.S. Department of Energy put the national cost of power interruptions at approximately $80 billion annually, and found that momentary interruptions lasting five minutes or less accounted for roughly two-thirds of that total while sustained interruptions accounted for the remaining third (LBNL, 2004). A more recent Berkeley Lab estimate put sustained interruptions alone at about $44 billion per year in 2015 dollars, with industry carrying 27% of that cost (LBNL, 2016).
The same source records that industrial customers carry a far higher cost per event than commercial ones, because a stopped process does not restart itself. An EU survey cited in the same Department of Energy review concluded that poor power quality cost the EU-25 more than €150 billion, with industry responsible for more than nine-tenths of the waste and dips and short interruptions accounting for almost 60% of the industrial cost (NETL, 2009).
None of those figures tells a plant what to do, but they explain why an instrument with event capture is worth more than one without. A mean cannot see a 60 ms dip; an event log can, and the event log is the only artefact that will persuade a utility that the disturbance came from their side of the meter.
Power quality monitoring: fixed or portable
The choice between a portable campaign and permanent power quality monitoring is a choice about who is watching and how often, and it is made on economics rather than on capability. A portable instrument answers a question that has already been asked. A fixed monitor answers questions that have not been asked yet, which is worth paying for only where the consequence of an unrecorded event is larger than the cost of the monitor.
Power quality monitoring in the fixed sense means an instrument installed at a defined point, powered continuously, time-synchronised and reporting to a system that stores and compares the record over years. The measurement methods are the same ones a portable instrument uses, so the difference is not accuracy but continuity: the fixed monitor sees every event because it is always connected, and the portable instrument sees only the events that happen to fall inside its campaign window.
| Criterion | Portable campaign | Permanent monitoring |
|---|---|---|
| Question being answered | A specific complaint, already raised | Whether the supply meets its limits over time |
| Coverage | Days to weeks, at chosen points | Continuous, at fixed points |
| Cost per point | One instrument, many points | One instrument per point |
| Cost of missing an event | High, the campaign has to be repeated | Near zero |
| Practical constraint | Access, power and security at each point | Panel space, supply and communications |
| Typical user | Contractor, plant engineer, commissioning team | Utility, large industrial site, data centre |
The economics usually settle it. Monitoring a single 11 kV incomer for a year with a portable instrument means repeat visits, access permits and the risk that the disturbance happens during the two weeks the instrument was elsewhere. The same year with a fixed monitor costs one installation and produces a record that covers every event. Against that, monitoring forty distribution boards for a week each is a job for one portable instrument and a technician, and installing forty fixed monitors to answer the same question is a waste of capital.
The hybrid is common and worth naming. A portable unit is used to find the point where the problem is worst, and a fixed unit is then installed there permanently. That sequence gets the benefit of both: the survey does the diagnosis, and the permanent monitor does the watching.
Limitations and boundaries
The numbers from this instrument carry more apparent confidence than those from any other instrument in a test department, and four limitations bound what they can support.
The first is that the instrument measures at its own terminals and nowhere else. A voltage distortion figure at a busbar is the result of the whole system impedance and every load connected to it, and attributing it to a single customer requires either a measurement at the point of common coupling with the load disconnected or an analysis that the instrument cannot perform. The common practice of pointing a meter at a feeder, reading 6% distortion and billing the customer on that feeder has no basis in the measurement (IEC 61000-4-30:2025).
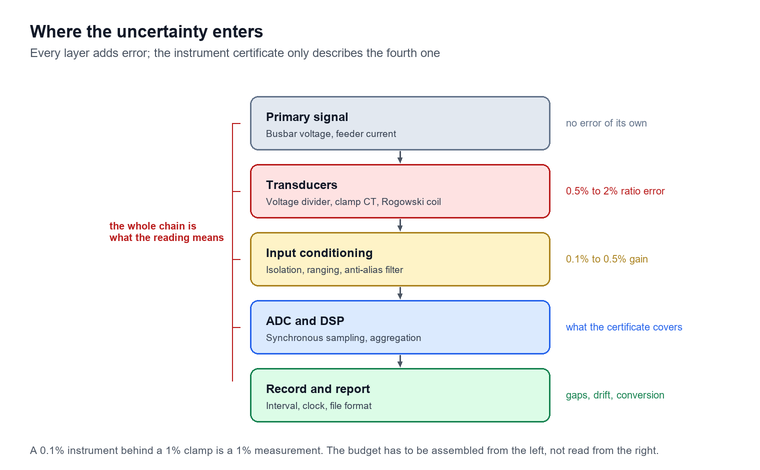
The second is that transducers set a floor on accuracy that the electronics cannot lift. A Class A instrument with 0.1% voltage uncertainty fed from a voltage transformer of class 0.5 is a 0.5% measurement, and the uncertainty budget has to be assembled from the whole chain rather than read from the instrument’s certificate. The same applies with more force to current: a clamp with a 1% ratio error makes the power measurement a 1% measurement regardless of the power channel’s specification.
The third is that the aggregation hides what it aggregates. A ten-minute mean is a mean, and a supply that meets every ten-minute limit can still destroy a drive with a 5 ms transient. Conversely, an event log without the corresponding aggregated values cannot distinguish a genuine supply problem from a switching transient on a supply that is already at the top of its band. Reading one without the other is the most common analytical error in power quality work.
The fourth is cost against benefit, and it is the one that keeps getting skipped. A Class A instrument with GPS synchronisation, four current channels, transient capture and a calibrated clamp set costs several times a Class S survey meter, and for a plant whose only question is whether the new drive has made distortion worse, the extra capability produces no additional decision. The reverse mistake is worse: buying the cheap instrument for a compliance campaign and discovering at report time that the record has gaps, the clock drifted, or the declared input voltage was never entered.
Frequently asked questions
These are the questions that come up most often when a power quality analyzer is being specified, connected for the first time or used to support a complaint. Each answer stands on its own.
Do I need Class A or is Class S enough?
It depends on who will read the result. Class A is required when the record will be used for contractual compliance, a utility dispute or a grid-connection acceptance test, because only Class A carries the defined uncertainty, the gap-free aggregation and the time synchronisation that those processes assume. Class S is adequate, and cheaper, when the result is an internal engineering input that your own team will act on.
Can I measure power quality with a clamp meter and a multimeter?
You can measure voltage, current, power and a total distortion figure, and for a quick check of whether a supply is roughly healthy that is enough. What you cannot do is demonstrate compliance with a limit, because a multimeter has no defined aggregation interval, no event capture and no way to show that its ten-minute value would agree with another instrument’s. The distinction is not about precision, it is about method.
Why is my neutral current higher than any phase current?
Triplen harmonics, the third, ninth and fifteenth, are in phase in all three phases of a four-wire system and add in the neutral instead of cancelling. A distribution board feeding switch-mode supplies or single-phase rectifiers can therefore carry a neutral current well above the phase current, and a neutral sized on the fundamental alone will overheat. Measure the neutral directly with a fourth channel rather than inferring it from the three phases.
How long should I record to investigate a flicker complaint?
At least a week, and it should include the period when the complaint occurs. Flicker limits are written as a long-term value over two hours, assessed for 95% of a week, so a two-hour recording cannot demonstrate compliance or non-compliance. Set the instrument to record ten-minute values continuously and to capture events, and check the clock at both ends of the campaign.
What does a voltage dip look like in the data?
A sharp drop in RMS voltage lasting from half a cycle to about a minute, recorded as an event with a retained voltage and a duration, and usually invisible in the ten-minute mean. If the instrument only logs aggregated values, the dip appears as a slight reduction in one ten-minute average, which is why event capture with a pre-trigger buffer is a specification item rather than an optional extra.
Can the analyzer tell me which customer caused the distortion?
No. Distortion at a busbar is the result of the whole system impedance and every load connected to it, and separating one customer’s contribution requires a measurement at the point of common coupling with the other loads known or disconnected. The instrument can show that distortion exists, which order dominates and when it appears, and that evidence often identifies the source by timing, but it cannot apportion responsibility on its own.
Does the clamp ratio matter if I correct it in software later?
Only if you recorded the ratio at the time. If a 1000 A clamp is configured as a 100 A clamp, every current, power and harmonic current value is wrong by the same factor, and the correction can be applied afterwards provided the ratio, the clamp serial number and the range were written on the job sheet. Without that record the data is unrecoverable, which is why the ratio belongs on the installation form, not in someone’s memory.
Conclusion
The specification of a power quality analyzer comes down to four decisions taken in the right order: which class the output has to satisfy, which of the four jobs the instrument is for, how many channels and which clamps the circuit actually needs, and how the recording will be powered and time-stamped for its full duration. Almost every disappointment in this field traces back to one of those being decided late, usually after the instrument has been bought.
For a buyer, the practical sequence is to write down the standard the report has to meet, then the duration and the interval, then the highest harmonic order and the largest current that must be resolved, and only then to look at instruments. A specification written in that order usually excludes most of the market on its own, which is the point: it is far cheaper to discover the mismatch on paper than in the second week of a compliance campaign.
Baoding Houfeng supplies portable units, unbalance recorders and the waveform recorders that follow a disturbance investigation. The instruments sit under the category page for these instruments, with individual units on the handheld analyzer, portable power quality meter, three-phase current unbalance analyzer and waveform recorder pages. For sites where the same busbar feeds both drives and metering, the AC power quality monitor guide covers the fixed-monitor side of the same decision, and the cable testing and monitoring guide covers the cable-side diagnostics that a distortion investigation sometimes needs. Company background is on the about us page. One instrument bought for one job rarely covers the next one without a second unit. For a project that mixes a compliance campaign with a permanent monitoring requirement, contact us with the system voltage, the largest conductor to be clamped and the standard the report must satisfy, and we will tell you which combination of instruments covers it.
References and technical sources
- IEC 61000-4-30:2025, Electromagnetic compatibility (EMC) — Part 4-30: Testing and measurement techniques — Power quality measurement methods, edition 4.0, International Electrotechnical Commission, 2025, which cancels and replaces IEC 61000-4-30:2015 and defines Class A and Class S. webstore.iec.ch/en/publication/71611
- IEC 62586-2:2017, Power quality measurement in power supply systems — Part 2: Functional tests and uncertainty requirements, International Electrotechnical Commission, 2017. webstore.iec.ch
- EN 50160:2022, Voltage characteristics of electricity supplied by public electricity networks, CENELEC, which sets the 2% unbalance, 8% THD and long-term flicker limits applied in this guide. cencenelec.eu
- CEER, 6th Benchmarking Report on the Quality of Electricity and Gas Supply, Council of European Energy Regulators, which tabulates the EN 50160:2022 limits and their assessment periods. ceer.eu
- IEC 61000-4-7:2002+AMD1:2008, Electromagnetic compatibility (EMC) — Part 4-7: Testing and measurement techniques — General guide on harmonics and interharmonics measurements and instrumentation, International Electrotechnical Commission. webstore.iec.ch
- IEC 61000-4-15:2010+AMD1:2025, Electromagnetic compatibility (EMC) — Part 4-15: Testing and measurement techniques — Flickermeter, functional and design specifications, International Electrotechnical Commission. webstore.iec.ch
- K. Hamachi LaCommare and J. H. Eto, Understanding the Cost of Power Interruptions to U.S. Electricity Consumers, Lawrence Berkeley National Laboratory report for the U.S. Department of Energy, 2004, which estimates the national cost of interruptions at approximately $80 billion per year. energy.gov
- U.S. Department of Energy, National Energy Technology Laboratory, Provides Power Quality for the Digital Economy, 2009, which summarises the EU-25 power quality cost survey and industrial interruption cost data. netl.doe.gov
- IEEE Std 519-2022, IEEE Standard for Harmonic Control in Electric Power Systems, IEEE Standards Association, which sets the voltage and current distortion goals at the point of common coupling. standards.ieee.org