

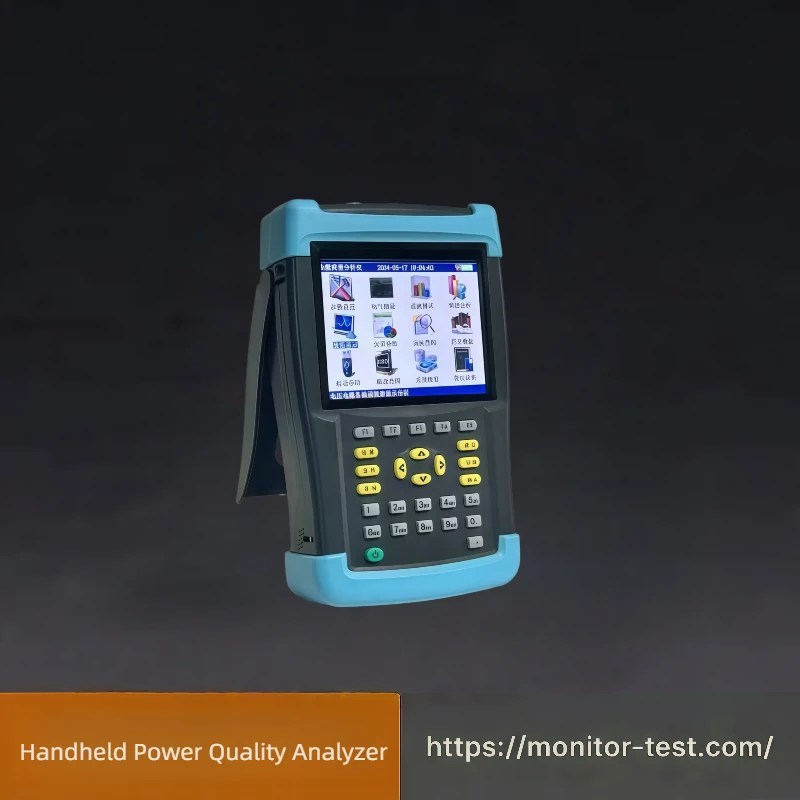
An AC power quality monitor records what the voltage and current at a point in the network actually do over time. It does not answer the question “is there power here” — a multimeter answers that. It answers a harder question: how far does the supplied power deviate from the ideal, how often, and for how long. That is the information a maintenance or energy team needs when equipment overheats, drives trip without an obvious fault, or a customer disputes the quality of the supply.
The commercial definitions behind those words are standardised. GB/T 32507-2024, Power quality — Terminology, defines power quality as the degree to which the electrical characteristics at a specified point in the power system deviate from benchmark technical parameters — which parameters, and how they are measured, is what separates a real monitor from a data logger with a voltage input.
What an AC power quality monitor measures
IEC 61000-4-30, Power quality measurement methods, sets out the parameters that a power quality instrument is expected to record. In practical terms, a monitor is bought to capture some or all of the following:
- Power frequency — the actual system frequency and its variation over time.
- Magnitude of the supply voltage — RMS voltage against nominal, including slow drift and sustained under- or over-voltage.
- Voltage dips and swells — short reductions or rises in RMS voltage, with depth and duration, which is what most drives unexplained equipment trips.
- Interruptions — short and long loss of supply, separated from dips by duration.
- Harmonics and interharmonics — waveform distortion broken down by order, not just summed into one number.
- Flicker — the voltage fluctuation that produces visible lamp flicker, evaluated over standard aggregation periods.
- Voltage unbalance — the negative-sequence component of a three-phase supply.
- Transient overvoltages — very short, high-magnitude events such as switching transients and lightning surges.
Two measurement points matter here. Frequency, voltage magnitude, flicker, unbalance and harmonics are steady-state or slowly varying quantities, evaluated as aggregated values over time — 10-minute intervals being the usual aggregation for steady-state parameters. Dips, swells, interruptions and transients are events, evaluated by depth (or magnitude) and duration. An instrument that only logs one of those two families will leave half the picture empty.
Online monitor or portable analyzer?
This is the first decision, and it is decided by the question you are trying to answer rather than by budget.
- Permanent, online monitoring — installed at a busbar, switchboard or feeder and left in place. This is how you catch intermittent events that happen at 3 a.m. and never reproduce while an engineer is standing there. See our power quality monitors: fixed units covering single-channel and dual-channel feeders up to 8-channel switchboard monitoring, plus harmonic-only monitoring from the 2nd to the 30th order.
- Portable analyzers and meters — carried to site for a survey, a commissioning check or a dispute investigation. This is what you take when the question is “what is happening here this week”, and the site is not a permanent installation. See our portable power quality analyzers, which include a portable meter, a handheld analyzer, a three-phase current unbalance analyzer and a waveform recorder.
The two are complementary rather than alternatives. A portable survey first establishes which feeder is behaving badly; a fixed monitor then proves how often, and produces the record that supports an argument. Monitoring transformers behind that supply is a different measurement problem again — dissolved gas analysis watches the insulation, not the voltage — and we cover that separately in transformer online DGA monitoring.
Channel count: the number that decides the installation
Channel count is not a specification you upgrade later — it determines where the instrument can physically be installed and what it can say in one record.
- Single channel — one circuit. Suits a single critical feeder, a generator output, or a dedicated load such as a large drive where the question is local. See the single channel power quality monitor.
- Dual channel — two circuits in one instrument, which is the practical minimum for comparing an incoming supply against the load it feeds, or for separating the utility’s contribution from your own. See the dual channel power quality monitor.
- Eight channels — a complete switchboard or a multi-feeder board recorded on one time base, so a disturbance on one feeder can be correlated with what the others did in the same millisecond. See the 8-channel power quality monitor.
If the purpose is to find the source of a disturbance rather than to verify one supply, the multi-channel option is the one that shortens the investigation: a single-channel record shows that something happened, while a synchronised multi-channel record shows where it came from.
Harmonics: the parameter that most often changes the answer
Modern networks carry increasing nonlinear load — converters and rectifiers, variable-speed drives, electrified railways, arc furnaces, PV inverters and EV chargers. The result is harmonic distortion, and because distortion is produced by the load, it cannot be evaluated from a nameplate. It has to be measured, per order.
An aggregate total harmonic distortion figure is enough to raise a flag and not enough to act on. The order tells you the source: low-order odd harmonics point at rectifier and switching topologies, triplen orders (3rd, 9th, 15th) accumulate in the neutral of a four-wire system, and higher orders point at resonance. That is why a dedicated harmonic monitor such as the HF-PQ-206 harmonic monitoring device reports the fundamental plus the 2nd to 30th voltage and current harmonics individually, on busbars and lines, rather than summarising them.
What the standards require from the instrument
The standards serve two different purposes, and mixing them up is a common way to buy the wrong instrument.
- IEC 61000-4-30 defines how the measurement is made — method, accuracy and time aggregation — and defines two classes. Class A is the stricter class: measurements made with Class A instruments are intended to be repeatable and comparable between instruments, which is what makes them usable for contractual verification or a dispute. Class S is a lighter class that gives comparable results without the same constraints on aggregation and flagging.
- IEEE 1159-2019, Recommended Practice for Monitoring Electric Power Quality, describes the electromagnetic phenomena themselves, the monitoring devices and the interpretation of results. It is the reference to read when deciding what to monitor and what the record means.
- EN 50160 sets the characteristics that the supply voltage in European public networks is expected to remain within under normal operating conditions — for example, that 95% of 10-minute RMS voltage values stay within ±10% of nominal over a week, with a comparable approach to harmonic voltage limits (voltage THD in the order of 8% for 95% of the time in low-voltage networks). That is a limit on the supply, and a power quality monitor is how you demonstrate whether it is being met.
- GB/T 32507-2024 (replacing GB/T 32507-2016) is the Chinese terminology standard: it fixes the vocabulary of power quality, harmonics, unbalance, dips and swells, which is the reference to quote when writing a specification or a report that has to be unambiguous.
The practical rule: if the measurement could end up in front of a customer, a regulator or a contract, the instrument should be Class A to IEC 61000-4-30. If it is for internal trending, a Class S instrument that aggregates consistently is usually the better value.
Three questions to settle before you buy
- What has to be proved, and to whom? An internal trend and a contractual dispute demand different accuracy classes, different aggregation and different reporting. Decide this first — it constrains everything else.
- Where will the instrument live? A permanent installation means enclosure, supply, CT/VT interfaces and a data path; a portable survey means battery, memory, safety rating and weight. A unit that is awkward to install gets left in a cupboard.
- What happens to the data? Stored locally, exported as a record, or pushed to a system someone actually reads? Monitoring that nobody reviews produces a file, not a result.
Frequently asked questions
What is the difference between a power quality analyzer and a power quality monitor? An analyzer is portable and used for surveys and commissioning checks; a monitor is installed permanently to record the same parameters continuously and catch intermittent events. Many projects start with an analyzer survey and then install a monitor on the feeder that the survey identified.
How many channels do I need? One channel covers a single circuit. Two channels are the practical minimum for comparing a supply with its load. Eight channels record a whole switchboard on one time base, which is what allows a disturbance to be traced back to the feeder that caused it.
Do I need harmonic measurement, or is voltage and current enough? If the site contains converters, drives, rectifiers, electrified railways, arc furnaces, PV inverters or EV chargers, harmonic measurement is the part of the record that explains the symptoms. Aggregate distortion indicates a problem; per-order harmonics indicate its source.
What does IEC 61000-4-30 Class A mean in practice? It defines the measurement method, accuracy and time aggregation so that results from different Class A instruments are repeatable and comparable. That comparability is what makes a record defensible in a contractual or dispute context; Class S instruments are intended for comparable results where that level of rigour is not required.
Can one instrument cover both a permanent installation and site surveys? Not usually, and not well. Permanent monitoring favours fixed mounting, continuous recording and remote data, while surveys favour portability and battery operation. Treating them as one purchase is a common reason monitoring projects stall after the first week.
If you are not sure which of the two you need, describe the symptom rather than the specification — what trips, when it trips, and what changed on site beforehand. That is enough to choose between a survey instrument and a permanent power quality monitor, and to decide how many channels the problem actually has.