

Online DGA monitoring vs laboratory DGA testing is not a contest between a better method and a worse one. Treating it as one is the fastest way to buy the wrong instrument. The two answer different questions, and most transformer fleets end up needing both. A continuous monitor measures dissolved gases every 30 minutes to 24 hours and raises its own alarm. A laboratory test returns a slower number that a regulator, a warranty claim or an insurer will accept without argument. This guide compares the two methods on the six factors that change a maintenance plan: detection window, accuracy, trend data, labour, cost and remote capability. It closes with a table for allocating each method across a transformer fleet. Every figure is traceable to a published standard or a stated source.
Key Takeaways
- The decisive difference is time, not chemistry. A continuous monitor leaves a blind spot of about 30 minutes, a quarterly laboratory programme leaves 90 days, and an annual one leaves 365.
- Laboratory gas chromatography stays the reference method at roughly ±1 µL/L. It remains mandatory for acceptance testing, warranty and insurance claims, and post-alarm confirmation.
- Cost only settles the question when it is framed as cost per year of coverage. A ten-year model for one 40 MVA unit gives $28,000 for quarterly laboratory testing against $57,000 for a monitor plus annual cross-checks.
- Most utilities converge on a tiered programme: permanent monitors on the 10–20% of units whose failure would hurt most, laboratory testing on the rest, and one cross-check per monitored unit every 6 to 12 months.
- Neither method sees a fault that produces no dissolved gas. Dry-type partial discharge and pure mechanical damage stay invisible to both, so DGA is one input rather than a complete condition picture.
How Online DGA Monitoring and Laboratory DGA Testing Differ
Both methods measure the same seven fault gases and can use the same detection principles, so the differences that matter are where the oil is analysed and how often, not what is being looked for. One method sits inside the transformer and reports continuously. The other sits in a laboratory and reports when a sample arrives. Almost every practical difference in this comparison follows from that split, which is why the sections below start with mechanics rather than with a feature list.
How laboratory DGA testing works
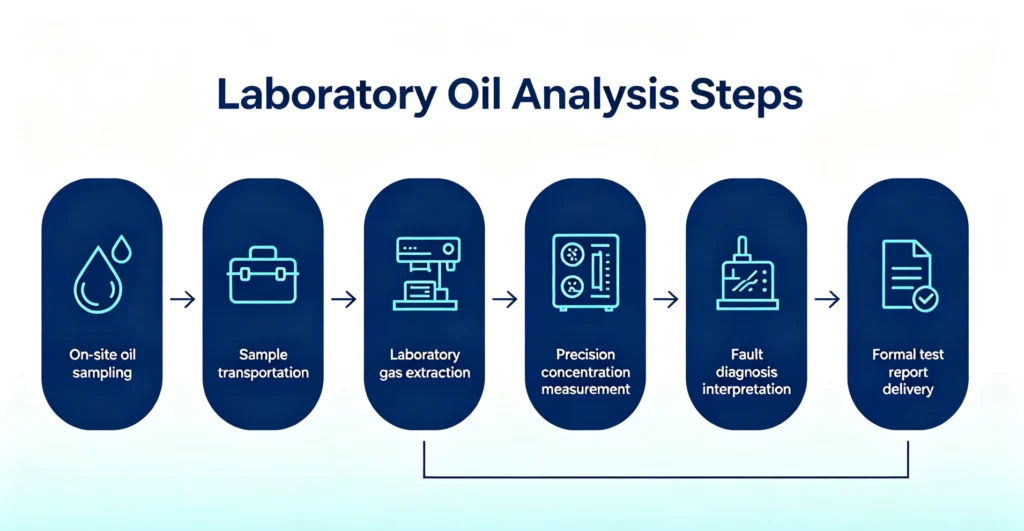
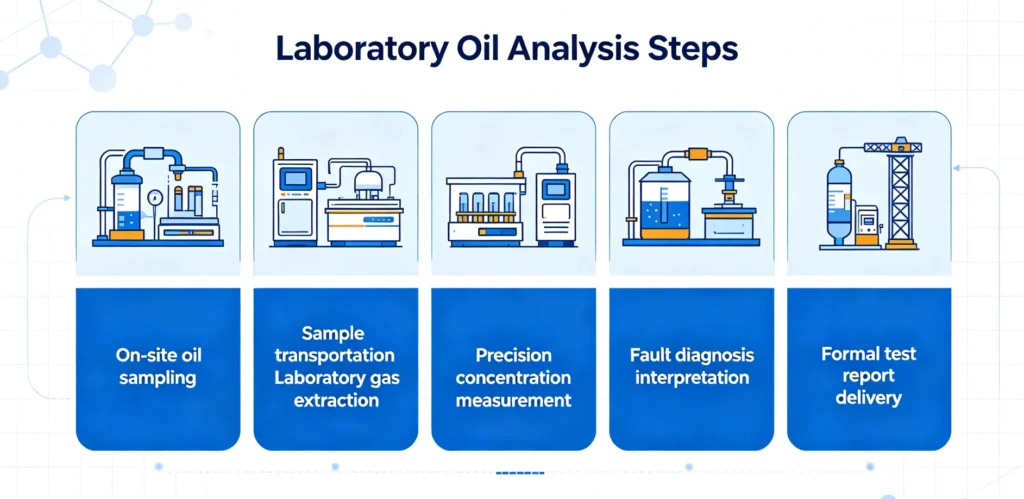
Laboratory testing follows a fixed chain. Oil is sampled on site and shipped to a certified laboratory. The laboratory extracts the dissolved gases, separates them by gas chromatography, and interprets the result against a standard. A formal report follows. End to end the cycle usually takes three to seven working days. Each link can add error. Extraction and measurement follow ASTM D3612 and IEC 60567:2022. Interpretation follows IEC 60599:2015.
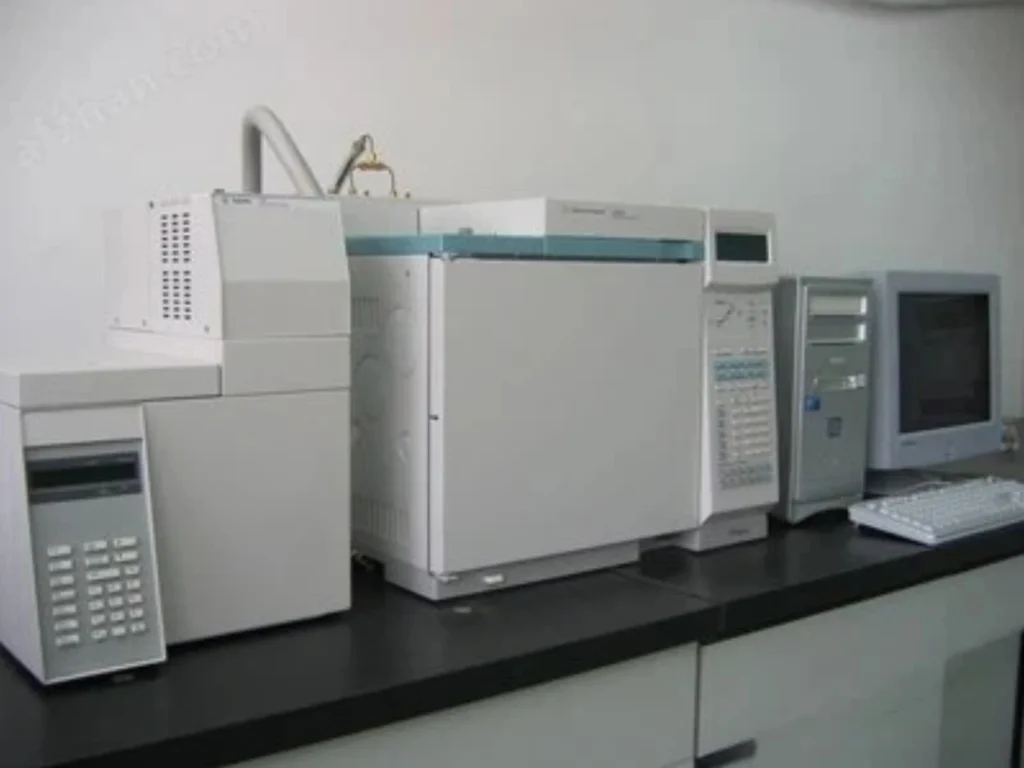
The weak link is rarely the instrument. An under-filled syringe, trapped air or a delayed shipment can shift a result further than the gap between two analysers. That is why good laboratories audit sampling procedure as closely as instrument calibration. A laboratory result is also a snapshot. It describes the oil at the moment of sampling. It says nothing about what happened afterwards.
How online DGA monitoring works
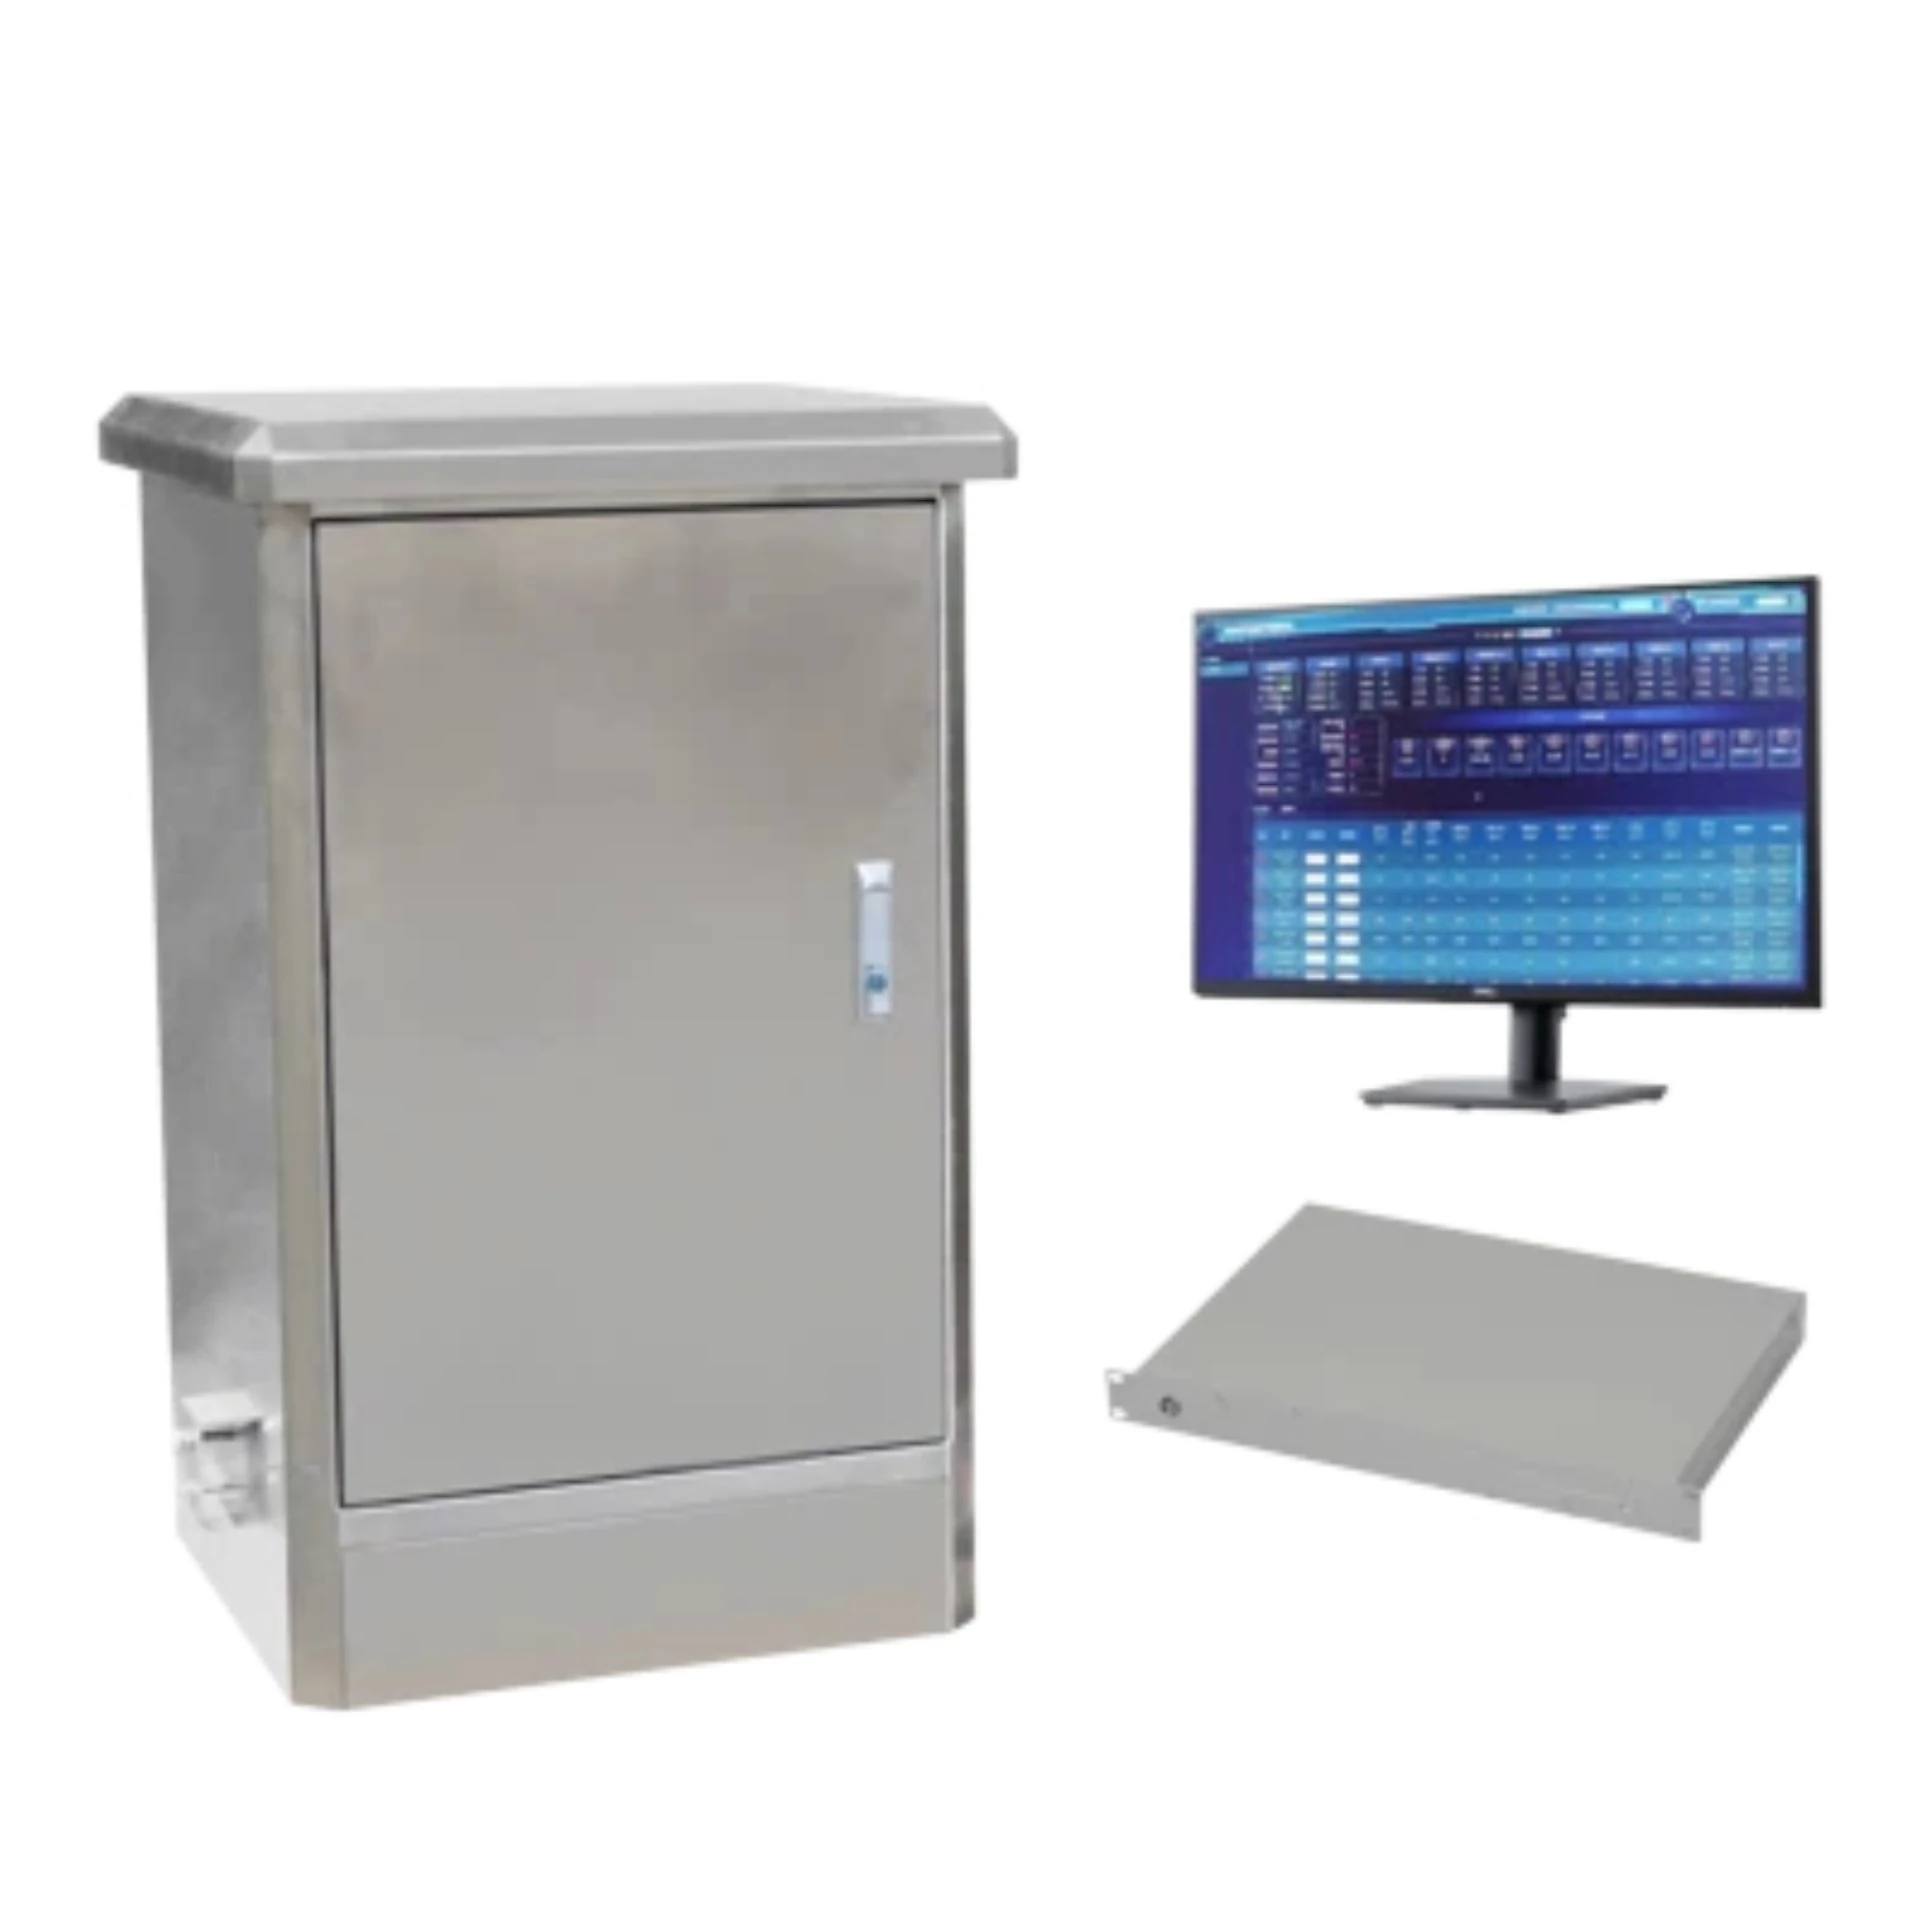
An online monitor circulates oil from the transformer through a measurement cell on a fixed cycle. It extracts the dissolved gases by headspace or membrane contact and reports concentrations without human intervention. The cycle is configurable, typically between 30 minutes and 24 hours. The instrument applies its own threshold and rate-of-rise logic before pushing an alarm to SCADA or a central platform. Extraction and detection technology is covered in more detail on the online DGA monitoring system page.
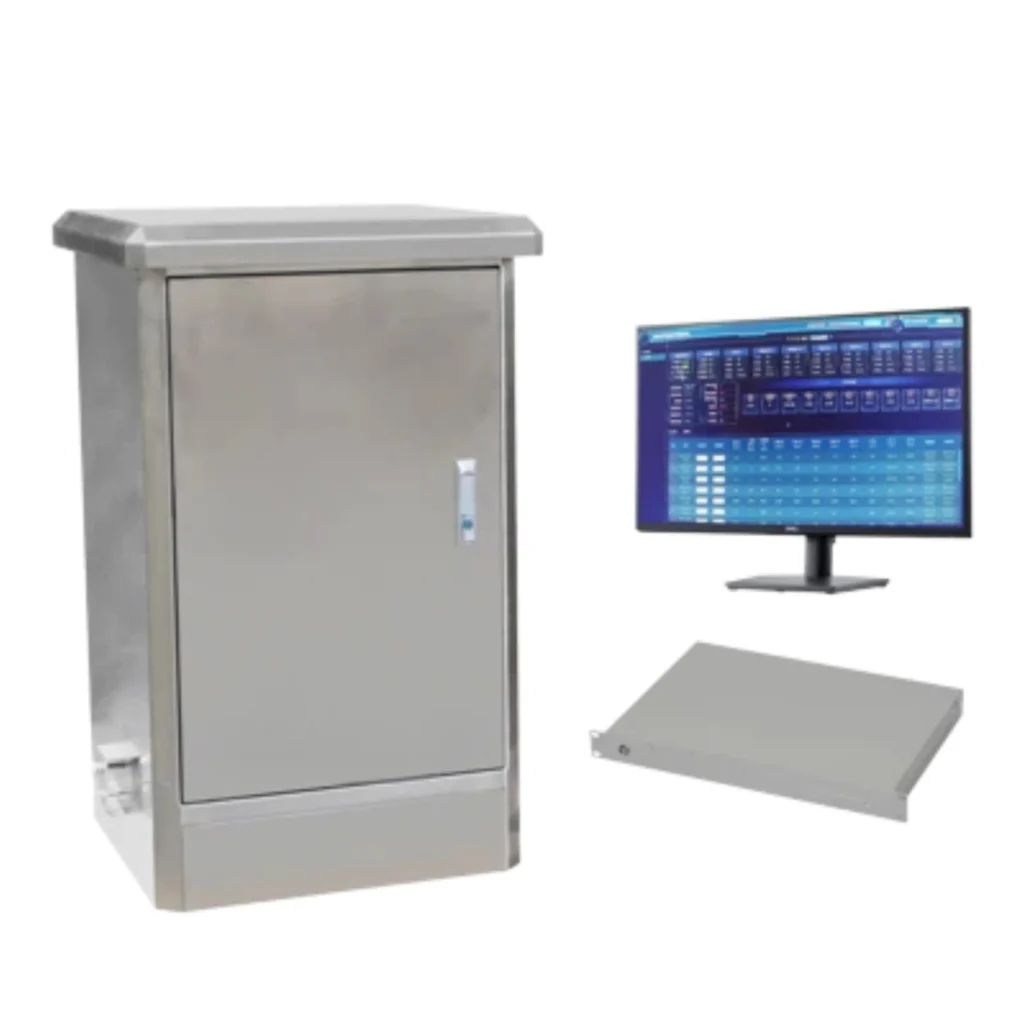
Because the monitor takes many readings, it builds a curve rather than a point. That curve is what makes rate of change usable. A unit climbing 10 µL/L a day is more concerning than one sitting stable at 300 µL/L. Only a continuous instrument can tell those two apart without waiting for the next visit.
| Decision factor | Online DGA monitoring vs laboratory DGA testing |
|---|---|
| What is measured | The same 7 fault gases plus moisture; a laboratory panel can add furans, acidity, interfacial tension and breakdown voltage |
| Where the oil is analysed | Inside the transformer’s oil loop, or in a certified laboratory on a shipped sample |
| Reporting cycle | Continuous, typically 30 minutes to 24 hours |
| Trend data | Automatic rate-of-change curve |
| Alarming | Active, pushed to SCADA |
| Typical capital cost | $8,000–$60,000 per monitor |
| Typical running cost | $1,000–$8,000 per unit per year |
What the two methods share
It is worth stating what does not differ, because a surprising amount of procurement argument is spent on features both methods have. Both detect the same seven fault gases defined by IEC 60599:2015, and both resolve them well enough to see a trend. Both depend on the quality of the oil-to-sensor interface, whether that interface is a syringe or a circulation loop. Both need the same interpretation framework once the numbers arrive, whether that framework is applied by a laboratory chemist or by threshold logic in a monitor.
The differences that remain are all about time and custody. Time is the reporting interval. Custody is who handles the sample between the transformer and the result. A laboratory programme has a long custody chain and can prove its chain of custody on paper. A monitor has a short chain and no paperwork, which is a strength for trending and a weakness for disputes. When a result has to survive an argument, the laboratory route is still the one that carries the evidence.
What site conditions actually change
The same two methods behave differently on different sites, and the difference is usually logistical rather than technical. [PERSONAL EXPERIENCE] On projects we have commissioned, the deciding factor was rarely instrument quality. It was how long a crew needed to reach the transformer. A mountainous or offshore substation can turn one oil sample into a two-day trip. That trip cost then dwarfs the laboratory fee, and it is the number a fleet plan should be built around.
Loading pattern matters too. A unit that runs near its nameplate rating for weeks at a time generates gas faster than a lightly loaded one, so the same sampling interval carries different risk. Ambient conditions add a third variable. High humidity promotes moisture ingress, and moisture changes how quickly paper insulation degrades. None of this changes the chemistry. All of it changes how long a blind spot can be tolerated.
The Detection Window: The Number That Decides Your Risk
A laboratory programme can only see a fault at the moment a sample is taken, which means its blind spot is exactly as long as the interval between visits, and that interval is the number most maintenance plans get wrong. Annual testing leaves up to 365 days in which a developing fault is invisible. Quarterly testing leaves 90. A monitor on a 30-minute cycle leaves 30 minutes. The gap decides whether a fault becomes a scheduled repair or a forced outage.
IEEE C57.104-2019 pairs each gas condition with a recommended response. The escalation is steep enough that the interval should follow the condition rather than the calendar.
| IEEE C57.104 condition | Total dissolved combustible gas (µL/L) | Recommended action and sampling interval |
|---|---|---|
| Condition 1 — Normal | ≤ 720 | Continue the standard interval: annual testing for most power transformers |
| Condition 2 — Caution | 721–1,920 | Investigate rate of change; increase to monthly sampling |
| Condition 3 — Warning | 1,921–4,630 | Active fault likely; plan intervention with weekly sampling |
| Condition 4 — Critical | > 4,630 | Imminent failure risk; consider removal from service, with daily or hourly monitoring |
Why acetylene makes the interval the real risk
Rate of change matters more than the absolute level, and acetylene shows why. IEEE C57.104-2019 places C₂H₂ above 35 µL/L in Condition 4. Arcing can drive a transformer from 1 µL/L to that level within days. A quarterly or annual programme can miss the whole event. A monitor on a short cycle catches the rise as it happens. Acetylene is also the clearest marker of high-energy discharge. The full gas-to-fault mapping sits in the DGA fault detection guide.
The practical consequence fits on one line. The maximum acceptable blind spot should be shorter than the time the fastest credible fault needs to become destructive. For arcing that is hours. For slow thermal degradation, months are tolerable. That is exactly why one site-wide sampling interval is the wrong instrument.
How to set the interval for one unit
The interval for a single transformer should come from four inputs, and none of them is the fleet average. Start with the consequence of failure for that asset. Add the OEM baseline for that model. Add the loading profile of the last twelve months. Add the cost of reaching the site. A unit that is critical, heavily loaded and hard to reach earns a short interval or a monitor. A unit that is spare, lightly loaded and easy to reach can wait longer.
Then fix the escalation rule in advance. Write down what happens at each condition level before any alarm arrives. A rule that says “Condition 2 gets a laboratory sample within 30 days and a manual inspection within 90” removes the argument that otherwise happens at two in the morning. It also protects the engineer who follows it.
Review the interval once a year against actual gas trends. An interval that has never triggered a sample is either correct or too long, and only the trend data can tell you which. A unit whose hydrogen has crept upward for three consecutive samples is no longer a Condition 1 unit, whatever the absolute value says.
Two units can carry the same gas level and still need different responses. A stable 400 µL/L reading on a lightly loaded unit in Condition 2 may simply need monitoring. The same 400 µL/L on a unit that added 100 µL/L in a week needs a laboratory confirmation and an inspection, because the rate is what changed, not the level.
One more timing point is easy to miss. Gas does not reach equilibrium instantly after a load change, so a sample drawn minutes after a step change can differ from one drawn hours later on the same unit. A continuous monitor averages that transient out across its cycle. A single laboratory sample captures whatever moment the technician happened to choose. Neither is wrong, but only one of them tells you what the transformer has been doing between visits.
Moisture and temperature deserve a specific mention, because they interact with gas data rather than standing apart from it. Water in oil raises the rate at which paper insulation degrades, and that degradation produces carbon oxides. A rising CO and CO₂ trend therefore cannot be read in isolation from the moisture record. This is one reason a single-gas limit table is a starting point rather than an answer.
Accuracy: Where the Laboratory Genuinely Wins
Laboratory gas chromatography remains the reference method for dissolved gas analysis, and its precision is the benchmark every online monitor is measured against, so anyone comparing the two should begin by conceding this point rather than arguing around it. A calibrated laboratory instrument resolves individual gases to roughly ±1 µL/L. Qualified online monitors are specified at about ±5% to ±15% of reading. That is enough to see a trend. It is not enough to defend a number to a regulator.
| Criterion | Laboratory DGA | Online DGA monitoring |
|---|---|---|
| Analytical method | Gas chromatography, the reference method | Photoacoustic, infrared or micro-GC sensing |
| Stated precision | Roughly ±1 µL/L on a calibrated instrument | Roughly ±5%–15% of reading |
| Result latency | 3–7 working days | 30 minutes to 24 hours |
| Panel width | 7–9 gases plus furans, PCB, acidity, interfacial tension, breakdown voltage | 5–9 gases plus moisture |
| Fitness for purpose | Acceptance, warranty, insurance, forensic diagnosis | Trending, alarming, continuous surveillance |
| Weak point | Sampling and transport error | Sensor drift, needing periodic cross-validation |
Sampling error often exceeds analyser error
Precision figures are quoted for the instrument, not for the whole chain. In field work the dominant error source is usually the sample itself. Air can enter through a leaking valve. A syringe can be under-filled. A bottle can sit in a vehicle for two days before it reaches the laboratory. A result can therefore carry more uncertainty than the specification suggests.
The honest way to report it is to state the method and the tolerance next to any number you quote. Write “±5% of reading, cross-validated against IEC 60567:2022 laboratory analysis” rather than a bare figure. A buyer or a reviewer increasingly checks that line.
Precision is also not the same thing as usefulness. A ±1 µL/L reading taken 90 days ago is less informative than a ±10% reading taken 30 minutes ago. That holds whenever the question is whether a fault is still growing. The trade-off, not a laboratory-versus-monitor argument, is the real subject of this comparison.
Cross-validation is the accepted practice, and it doubles as an acceptance test of your own programme. Run one laboratory sample per monitored transformer every 6 to 12 months, then log the deviation between the monitor and the reference result. A deviation that stays inside the stated tolerance confirms the sensor. A deviation that drifts over time usually points to a sampling-system problem rather than a sensor fault, and it is far cheaper to find on a schedule than during an incident.
Choosing Between Online DGA Monitoring vs Laboratory DGA Testing
The choice is not philosophical once the two methods are separated by detection window and cost, because the decision usually turns on three measurable things: how much the unit matters, how quickly a fault would escalate, and how hard the site is to reach. Rank the fleet on those three axes and the allocation follows almost by itself. The table below is the pattern most utilities converge on. Treat it as a starting point for a site-specific study rather than a fixed rule.
| Transformer type | Recommended programme |
|---|---|
| ≥ 220 kV, or > 100 MVA main unit | Online monitor plus quarterly laboratory cross-check |
| 110–220 kV substation or hub transformer | Online monitor plus semi-annual laboratory testing |
| Ageing unit (> 15 years) or known fault history | Online monitor plus monthly-to-quarterly laboratory testing |
| Remote or unattended site | Online monitor plus annual laboratory testing |
| Critical industrial or data-centre supply | Online monitor plus semi-annual laboratory testing |
| Distribution transformer below 10 MVA, accessible | Annual-to-biennial laboratory testing only |
| New unit under warranty | Laboratory testing per contract; a monitor is optional |
| Non-critical auxiliary or station-service unit | Laboratory testing per local regulation |
The tiered programme most utilities run
A tiered programme puts permanent monitors on the 10% to 20% of transformers that carry the most risk. It keeps periodic laboratory testing on the remainder. It runs one laboratory cross-check per monitored unit every 6 to 12 months to validate the sensor against a reference measurement. The sequence matters, so it is worth stating plainly.
- Rank by consequence, not by age. Voltage class, MVA rating, load factor, outage cost and site access decide how much a failure would cost. That number, not the price of a monitor, is what the decision should be measured against.
- Put the expensive instrument where the consequence is highest. Spreading monitors thinly across a fleet whose lower tiers are already covered by an annual sample wastes capital without shortening any meaningful blind spot.
- Escalate on condition, not on calendar. A unit in Condition 2 gets monthly sampling whether or not the annual plan has come around.
- Cross-validate every monitor. One laboratory sample per monitored unit every 6 to 12 months confirms the sensor and documents the deviation. That record is what makes the continuous data defensible later.
A useful cross-check is to ask which units you would already sample monthly if the budget allowed it. Those units are the monitor candidates, because a monitor replaces the sampling frequency you cannot afford to run by hand. The remaining units stay on the laboratory schedule set by their condition. If you are still narrowing the field, the criteria in the online DGA monitoring system selection guide apply the same logic to instrument choice.
What Each Method Actually Costs
Published 2026 estimates put a laboratory dissolved gas analysis at roughly $150 to $500 per sample, and a permanent online monitor at $8,000 to $60,000 per unit with $1,000 to $8,000 a year in maintenance, which means unit price settles very little on its own. The comparison only becomes useful when it is expressed as cost per year of coverage. The cost of one avoided forced outage belongs on the other side of the ledger.
| Cost item | Published 2026 estimate | Basis |
|---|---|---|
| Laboratory DGA, per sample | $150–$500 for a basic 7-gas analysis; up to about $1,200 for a full oil-quality panel | Commercial laboratory price guides |
| Online DGA monitor, per unit | $8,000–$60,000, depending on gas count and detection technology | Vendor and market reports |
| Full multi-parameter monitoring system | $25,000–$120,000 | Market reports |
| Annual maintenance, per online unit | $1,000–$8,000 for calibration, consumables and service | Vendor and market reports |
| Sampling labour and logistics, per visit | Site-dependent; the dominant cost at remote or mountainous substations | Utility practice |
| Cost of one avoided forced outage | $500,000–$3,000,000 including outage, emergency spares and lost supply | Industry loss estimates |
To make the trade-off concrete, here is a ten-year model for one 110 kV, 40 MVA transformer. It uses mid-range assumptions: $300 per laboratory sample, $400 per sampling visit, a $30,000 monitor and $2,000 a year in monitor maintenance.
| Ten-year cost | Laboratory only, quarterly | Online monitor plus annual laboratory cross-check |
|---|---|---|
| Laboratory tests | 40 samples × $300 = $12,000 | 10 samples × $300 = $3,000 |
| Sampling labour and logistics | 40 visits × $400 = $16,000 | 10 visits × $400 = $4,000 |
| Monitor capital | — | $30,000 |
| Monitor maintenance | — | 10 × $2,000 = $20,000 |
| Total | $28,000 | $57,000 |
| Detection window | Up to 90 days | 30 minutes |
On testing cost alone the laboratory programme is cheaper for this transformer, by roughly half. That result should be stated plainly rather than buried, because it is the honest answer and buyers notice when a vendor avoids it. Two things qualify it.
First, if the alternative is more frequent laboratory testing rather than no testing, the arithmetic flips. Monthly sampling costs $36,000 in tests plus $48,000 in visits, or $84,000 over ten years. That exceeds the monitor.
Second, and more important, the monitor is not bought to save testing cost. It is bought to shorten the detection window on an asset whose failure would cost $500,000 or more. The right question is therefore not whether a monitor is cheaper than a sample. It is what a shorter blind spot is worth on that particular unit.
The model above is sensitive to two assumptions more than to any other input, and it is worth running both. If sampling visits are cheap because the substation is in a city, the laboratory column falls and the monitor looks worse on cost alone. If visits are expensive because the site is remote, the laboratory column rises quickly and the monitor becomes cheaper over ten years. The table below shows how far the ten-year total moves when the visit cost changes.
| Ten-year total | Visit cost $150 | Visit cost $400 | Visit cost $900 |
|---|---|---|---|
| Laboratory only, quarterly | $18,000 | $28,000 | $48,000 |
| Monitor plus annual cross-check | $57,000 | $57,000 | $57,000 |
The break-even visit cost is therefore the number to estimate first, because it decides which column wins on cost. For this 40 MVA unit the two columns cross when a sampling visit costs roughly $700, which is common at remote or mountainous substations and rare at urban ones. Run the same arithmetic on your own site access cost before comparing equipment prices.
How to read a vendor quote
[UNIQUE INSIGHT] Vendor quotes for the same nominal specification can differ by a factor of three, and the differences usually sit outside the headline accuracy figure. Compare quotes on four lines instead. Ask for stated repeatability and long-term drift, not resolution. Ask how the sampling system behaves if oil flow is interrupted. Ask what a consumable kit costs per year. Ask who performs on-site calibration and how long a service visit is guaranteed to take.
A specification that reads well on a datasheet can still fail in the field. In our experience the failures that matter most originate in the sampling system rather than the sensor. Blocked lines, air ingress and pump wear cause more false readings than detection accuracy ever does. A quote that answers those four questions is worth more than one that leads with a precision number.
Limitations: What Neither Method Can Do
Neither method detects a fault that does not generate dissolved gas, and neither one diagnoses anything by itself, so both should be understood as instruments that feed a judgement rather than replace it. Dry-type windings with partial discharge, pure mechanical damage and some bushing defects can all develop with the gas profile barely moving. Below a certain asset value the economics also fail, and no amount of instrument quality changes that.
- It cannot see faults that produce no gas. Partial discharge in dry-type windings, mechanical damage and some bushing defects develop with the dissolved gas profile almost unchanged.
- It cannot locate a fault. Both methods say that a fault exists and roughly what type it is. Neither says where it is. Locating it still needs electrical tests or an internal inspection.
- It does not detect low-level faults in small units economically. For a distribution transformer below 10 MVA in an accessible location, the installed cost of a monitor usually exceeds the value of the failure it might prevent.
- A monitor alone is not a diagnosis. It flags a deviation. Confirming it needs a laboratory reference measurement, and complex cases need ratio methods such as the Duval Triangle method.
- Poorly set thresholds generate false alarms. Absolute limits that ignore a unit’s own baseline will cry wolf, and operators who learn to ignore alarms have lost the benefit they paid for.
One boundary is organisational rather than technical. A monitoring programme only works if someone owns the alarms. A monitor whose alerts land in an inbox nobody reads has the same detection window as an annual sample, because the data is never acted on. Naming an owner and a response time is part of the instrument’s value, not an administrative extra.
It is also worth separating two failure modes that are often confused. A monitor that reports no gas may be correct, or it may be blocked. A monitor that reports a rising trend may be seeing a real fault, or it may be drifting. Neither case is resolved by trusting the instrument more. Both are resolved by cross-checking against a reference measurement on a known schedule.
Two further constraints deserve a line each. Gas levels are influenced by transformer design, oil volume and loading history, so a limit that is correct for one unit can be wrong for another. Where an OEM baseline exists, it should take precedence over a generic table. Dissolved gas results are also most useful alongside temperature, moisture and partial-discharge data. That is the reasoning behind the wider condition-monitoring stack described in the DGA results interpretation workflow.
How Houfeng Supports a Monitoring Programme
Most buyers do not need another specification sheet, because what they need is a second opinion on which units justify a permanent monitor and how to cross-check it afterwards. Houfeng supplies both halves of the programme: permanent online monitors for the transformers that carry the most risk, and portable analysers for site visits, acceptance checks and alarm confirmation. The engineering team reviews a fleet list with voltage class, MVA rating, age and site access, then returns a shortlist of units where a monitor earns its cost.
The online DGA monitoring system for power transformers measures 7 gases plus moisture with rate-of-rise alarms and IEC 61850-3:2013 communications for SCADA integration. For site work and post-alarm verification, the portable dissolved gas analyzer returns 7-gas plus moisture results in about 20 minutes. That is short enough to confirm an alarm before deciding whether to de-energise. To work through which of your transformers should be monitored first, contact our engineering team with the fleet list and we will return a prioritised allocation.
Delivery scope matters once the technical case is settled, because a monitor that arrives after the outage season has missed the reason it was bought. We quote lead time, commissioning support and calibration scope in writing, and we plan the first year’s threshold tuning with the site team rather than leaving it to a manual. Support matters most in the first year, when a new monitor is still being tuned to its transformer. Baseline behaviour differs between units, and a threshold copied from a datasheet will be wrong on the first attempt. We set thresholds against the unit’s own first months of data and adjust them once the baseline is clear. A monitor that cries wolf is worse than no monitor at all, because operators stop reading it.
Frequently Asked Questions
What is the difference between laboratory DGA testing and online monitoring?
The difference is continuity against precision. Online monitoring measures continuously, typically every 30 minutes to 24 hours, and raises its own alarms, so a developing fault is caught within one cycle. Laboratory testing analyses a sample taken at one moment, to roughly ±1 µL/L, but the report arrives three to seven days later.
Is online monitoring more accurate than laboratory testing?
No. Laboratory gas chromatography remains the more precise reference method, at roughly ±1 µL/L against ±5% to ±15% of reading for a monitor. Online monitoring competes on temporal resolution, not analytical accuracy. It shows whether a fault is growing, which a single precise sample cannot do.
Can online monitoring replace laboratory testing altogether?
No. Online monitoring replaces laboratory frequency, not laboratory authority. A laboratory result is still required for acceptance testing, warranty and insurance claims and post-alarm confirmation. Only a certified laboratory produces a traceable, standards-referenced measurement, which is why most utilities run both.
How often should transformer oil be tested for dissolved gases?
IEC 60599:2015 and IEEE C57.104-2019 set the interval by condition rather than by calendar. A transformer in Condition 1 is typically tested annually, or every one to three years when the trend is flat. Condition 2 moves to monthly sampling, Condition 3 to weekly, and Condition 4 to daily or hourly.
What is the difference between online and offline DGA testing?
Offline testing means the oil is sampled on site and analysed elsewhere, in a laboratory or by a portable analyser. Online testing means a permanently installed instrument circulates oil from the transformer and analyses it in place. Online costs more upfront and removes the sampling interval entirely.
How long does a laboratory DGA test take, end to end?
Typically three to seven working days. That covers on-site sampling, transport, gas extraction, chromatographic analysis, interpretation and report delivery. A portable analyser shortens the answer to hours, which is why portable units are often used to confirm an alarm before a laboratory sample is dispatched for the record.
Which transformers most need continuous monitoring?
Those whose failure would be costly or slow to recover from: main units at 220 kV and above or over 100 MVA, ageing units past 15 years with a fault history, heavily loaded transformers, and remote sites where every sampling visit is expensive. Units where a failure is cheap to fix do not need one.
Is an online monitor worth the investment?
It depends on the consequence of failure, not on the cost of testing. For a transformer whose failure would cost $500,000 or more, a monitor that shortens the detection window to minutes is a low-cost hedge. For a small accessible distribution transformer, annual testing is usually the more sensible spend. That is the practical answer to online DGA monitoring vs laboratory DGA testing.
Conclusion: Which Method Fits Your Transformer?
Laboratory dissolved gas analysis is the authoritative, low-capital, standards-referenced method. It remains indispensable for acceptance testing, routine assessment, post-alarm verification, and any number that must stand up to a regulator, a warranty claim or an insurer. Its weakness is time. The blind spot equals the sampling interval, and no amount of laboratory precision fixes that.
Online monitoring is the continuous method. It trades a little analytical precision for a detection window measured in minutes. It also removes the sampling labour that dominates the cost of testing remote assets. Its weaknesses are capital cost and the fact that a monitor alone is not a diagnosis.
For most utilities and EPC projects the answer is a tiered programme rather than a choice. Put permanent monitors on the transformers whose failure would hurt most. Keep laboratory testing on the rest. Cross-check every monitored unit with a laboratory sample every 6 to 12 months. Deciding between online DGA monitoring vs laboratory DGA testing is therefore less a purchase decision than a matter of allocating two instruments to the units where each one earns its keep.
References and Data Sources
The detection windows, gas conditions and accuracy figures in this guide come from the standards and publications listed below. Where a figure is a market estimate rather than a standard value, the basis is stated beside it so the reader can judge how much weight to give it.
- IEEE C57.104-2019 — Guide for the Interpretation of Gases Generated in Oil-Immersed Transformers. Source of the Condition 1–4 limits and the resulting sampling intervals.
- IEC 60599:2015 — Mineral oil-filled electrical equipment in service: guidance on the interpretation of dissolved and free gases analysis.
- IEC 60567:2022 — Oil-filled electrical equipment: sampling of gases and of oil for analysis of free and dissolved gases.
- ASTM D3612 — Standard test method for analysis of gases dissolved in electrical insulating oil by gas chromatography.
- CIGRÉ — Technical brochures on transformer failure statistics and condition assessment.
- Cost benchmarks: published 2026 vendor price ranges and transformer DGA market reports. Figures are indicative planning ranges, not quotations.
Written by Leon Zhang, Transformer Condition Monitoring Engineer, 12 years in transformer oil diagnostics and transformer oil analysis. Technical review by Wang Jianguo, Senior Electrical Engineer, PE, 15 years in substation commissioning. Published September 9, 2026. Last updated: October 5, 2026.
[…] Online DGA System vs. Laboratory DGA Testing […]