

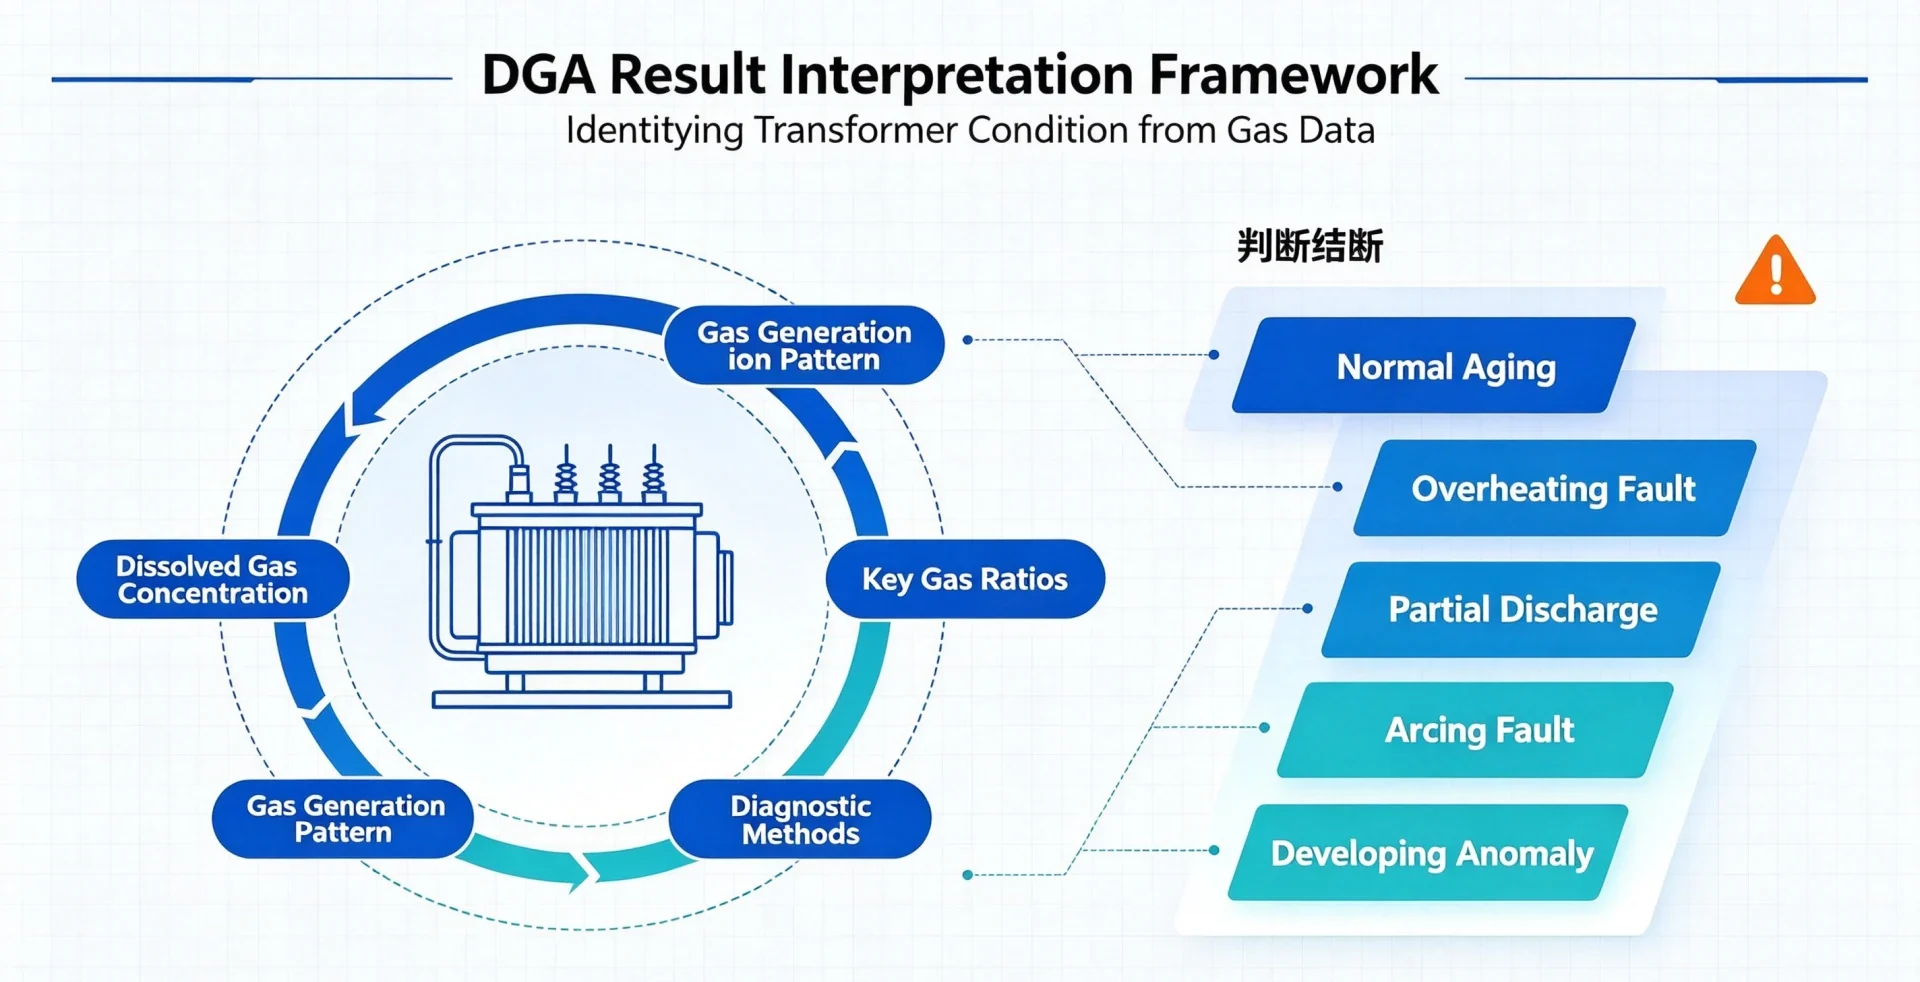
DGA results interpretation is the process of evaluating dissolved gas concentrations in transformer oil to identify abnormal gas generation, analyze gas relationships and trends, and determine the possible type and severity of transformer faults.
DGA results should not normally be interpreted from a single gas concentration alone. Gas levels, gas ratios, diagnostic patterns, historical trends, and transformer operating conditions should be considered together.
After reading this guide, transformer engineers, asset managers, EPC contractors and maintenance teams will be able to answer these practical questions from any DGA report:
- Which gases are abnormal?
- What does each gas indicate?
- How should gas ratios be interpreted?
- How can DGA identify transformer faults?
- When should further testing or maintenance be performed?
How to Read and Analyze DGA Results
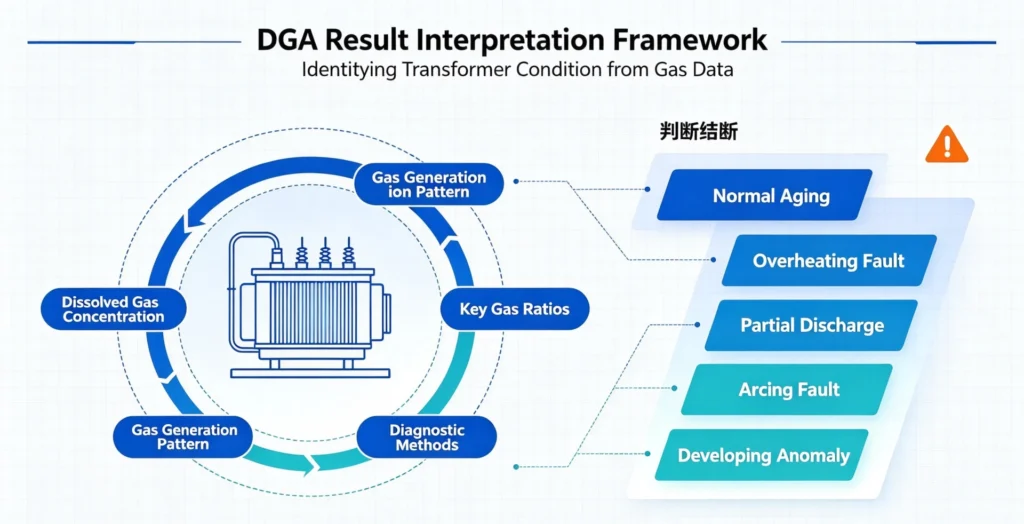
DGA results interpretation is the process of evaluating dissolved gas concentrations in transformer oil to identify abnormal gas generation, analyze gas relationships and trends, and determine the possible type and severity of transformer faults. DGA analysis should not normally be based on a single gas concentration alone — gas levels, gas combinations, ratios, historical trends, and operating conditions should be considered together.
What Does a DGA Report Usually Contain?
A DGA report first presents concentration data for each key gas, with different gases indicating different potential faults:
| Gas | What It May Indicate |
|---|---|
| H₂ | Partial discharge / electrical activity |
| CH₄ | Low-temperature thermal activity |
| C₂H₆ | Thermal decomposition |
| C₂H₄ | Higher-temperature thermal activity |
| C₂H₂ | Arcing / high-energy discharge |
| CO | Cellulose insulation degradation |
| CO₂ | Cellulose insulation condition |
Gas Concentration
The first step in DGA analysis is to review individual gas concentrations, typically expressed in ppm. In addition to individual gas values, total dissolved combustible gas (TDCG) and similar combined indicators are often used for an initial assessment of abnormal gas generation.
Gas Combination
DGA analysis cannot rely on a single gas alone. For example, elevated acetylene together with hydrogen may indicate a different condition from elevated methane and ethane. Gas combinations often reveal fault types more accurately than individual values.
Gas Trend
Trend analysis compares current values with historical values, evaluating gas generation rates and long-term changes. A single test result makes it difficult to determine whether a fault is developing or has stabilized, while trend data reveals whether gas levels are rising steadily, increasing rapidly, or remaining stable — providing the basis for subsequent diagnosis and maintenance decisions.
DGA Analysis: What Should You Look For?
DGA analysis involves more than reading individual gas values. To assess transformer condition accurately, three aspects should be examined together: gas concentration, gas generation rate, and relative gas composition.
Gas Concentration
Gas concentration is the starting point of DGA analysis. Key questions include:
- Is the gas concentration normal?
- Is it increasing?
- Is it increasing rapidly?
Individual gas values should be compared against standard limits such as IEC 60599 or IEEE C57.104, as well as the transformer’s own historical baseline. A concentration within limits does not automatically mean the transformer is healthy — its behavior over time matters just as much.
Gas Generation Rate
Gas generation rate indicates how quickly a fault may be developing. A relatively moderate gas concentration may still require attention if the rate of increase is high. Conversely, a stable concentration over a long period may indicate a dormant or resolved condition. Rate-of-rise analysis therefore provides earlier warning than concentration thresholds alone.
Relative Gas Composition
DGA analysis should also examine the proportional relationships between different gases, not just absolute values. For example, the ratio of C₂H₂ to C₂H₄ helps distinguish arcing from thermal faults, while CH₄ to H₂ ratios indicate discharge versus thermal behavior. These relationships naturally lead to the use of gas ratios as a diagnostic tool for identifying fault types.
How to Analyze DGA Gas Ratios
Gas-ratio analysis is an important part of transformer DGA analysis because it considers the relationship between different dissolved gases rather than treating each gas independently. Individual gas concentrations may fall within normal limits, yet the ratios between them can still reveal a developing fault pattern. This is why gas ratios form the basis of several widely used diagnostic methods, including Rogers Ratios, IEC Gas Ratios, and the Duval Triangle.
Why Gas Ratios Matter
Different fault types generate gases in different proportions. Thermal faults, partial discharge, and arcing each produce characteristic gas patterns. By comparing relative gas concentrations rather than absolute values, ratio methods help distinguish between these fault categories — even when overall gas levels are still relatively low.
Common Gas Ratios and Their Diagnostic Use
| Ratio | Formula | Diagnostic Use |
|---|---|---|
| CH₄/H₂ | CH₄ ÷ H₂ | Helps characterize discharge/thermal conditions |
| C₂H₂/C₂H₄ | C₂H₂ ÷ C₂H₄ | Helps distinguish discharge-related conditions |
| C₂H₄/C₂H₆ | C₂H₄ ÷ C₂H₆ | Helps evaluate thermal fault characteristics |
Rogers Ratios
Rogers Ratios use combinations of CH₄/H₂, C₂H₂/C₂H₄, and C₂H₄/C₂H₆ to classify fault types such as normal aging, partial discharge, arcing, and thermal faults of varying severity. The method provides a structured way to interpret gas relationships rather than relying on single values.
IEC Gas Ratios
The IEC 60599 ratio method applies similar logic, using three key ratios to indicate fault categories. It is widely referenced in international standards and is often used alongside the Duval Triangle for cross-verification.
How to Apply Gas Ratios in Practice
Gas ratios should not be used in isolation. They are most effective when combined with gas concentration levels, generation rates, historical trends, and transformer operating conditions. A single ratio outside its typical range does not confirm a fault, but it can indicate the need for closer monitoring or further testing.
DGA Diagnostic Methods for Transformer Fault Analysis
After reviewing gas concentrations, generation rates, and ratios, the next step is to apply structured diagnostic methods. Several internationally recognized approaches are widely used in transformer DGA analysis, each offering a different way to interpret gas data and classify fault types.
IEC 60599
IEC 60599 is an international standard that provides guidance on interpreting dissolved gas analysis results. It applies gas ratios to classify faults into categories such as electrical faults (partial discharge, arcing) and thermal faults (low, medium, and high temperature). The standard also defines typical gas concentration limits and recommended sampling intervals, making it a practical reference for both routine monitoring and fault investigation.
Duval Triangle
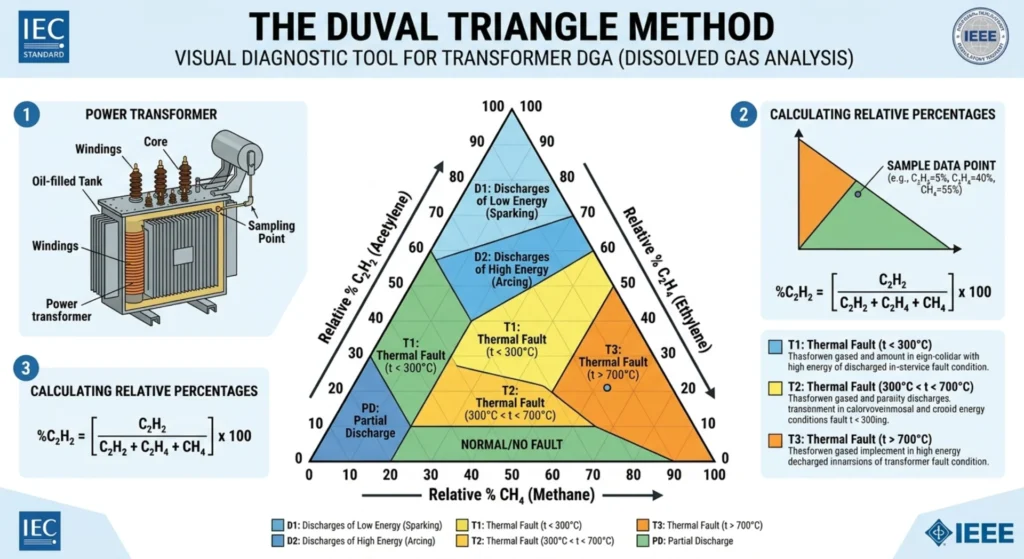
The Duval Triangle is one of the most widely used graphical diagnostic methods. It uses the relative percentages of three key gases:
- CH₄ (methane)
- C₂H₄ (ethylene)
- C₂H₂ (acetylene)
These three gases are plotted as percentage values on a triangular diagram divided into fault zones. The zone in which the plotted point falls indicates the likely fault type — such as partial discharge, thermal fault, or arcing. The method is valued for its visual clarity and has been extended into Duval Triangle 1 through 5 for different equipment types and fault conditions.
Rogers Ratio Method
The Rogers Ratio Method uses gas ratios to assign ratio codes, which are then matched against a fault interpretation table. It typically employs ratios such as CH₄/H₂, C₂H₂/C₂H₄, and C₂H₄/C₂H₆ to classify conditions including normal aging, partial discharge, arcing, and thermal faults of varying severity. The method provides a structured, repeatable way to interpret gas relationships.
Key Gas Method
The Key Gas Method is a simpler approach based on the principle that certain gases provide diagnostic clues for specific fault types. For example, elevated H₂ may suggest partial discharge, while elevated C₂H₂ may indicate arcing. This method is often used as a first-pass screening tool before applying more detailed ratio or graphical methods.
Using Diagnostic Methods Together
No single method should be relied on exclusively. In practice, IEC 60599, the Duval Triangle, Rogers Ratios, and the Key Gas Method are often used together to cross-verify results. Combined with gas concentration levels, generation rates, historical trends, and transformer operating conditions, they form a comprehensive framework for transformer fault analysis.
How to Interpret DGA Results Step by Step
Interpreting DGA results is a structured process that combines gas concentration data, ratio analysis, diagnostic methods, historical trends, and operating context. The following seven steps provide a practical framework for transformer engineers, asset managers, and maintenance teams.
Step 1: Check Individual Gas Concentrations
Review the concentration of each key gas in the DGA report:
- H₂
- CH₄
- C₂H₆
- C₂H₄
- C₂H₂
- CO
- CO₂
Record each value in ppm and compare it against applicable standards such as IEC 60599 or IEEE C57.104.
Step 2: Identify Abnormal Gases
Determine which gases are elevated compared with applicable limits or historical values. Not all elevated gases indicate a fault — some may reflect normal aging or transient conditions. Identifying which gases are abnormal is the first step in narrowing down the possible fault type.
Step 3: Analyze Gas Ratios
Determine whether the gas ratios correspond to a recognizable fault pattern. Ratios such as CH₄/H₂, C₂H₂/C₂H₄, and C₂H₄/C₂H₆ provide diagnostic clues that individual gas values alone cannot reveal.
Step 4: Apply a Diagnostic Method
Apply one or more structured diagnostic methods:
- IEC 60599
- Duval Triangle
- Rogers Ratio
- Key Gas Method
Cross-verification between methods improves diagnostic confidence.
Step 5: Check Historical Trends
Review previous DGA results to assess:
- Rate of gas increase
- Repeated abnormal patterns
- Sudden changes
A single measurement provides a snapshot; trends reveal whether a fault is developing, stabilizing, or accelerating.
Step 6: Determine the Most Likely Fault Type
Based on gas concentrations, ratios, diagnostic methods, and trends, determine the most likely fault type — such as partial discharge, thermal fault, arcing, or insulation degradation. This step represents the core of DGA fault diagnosis.
Step 7: Confirm With Operating and Maintenance Data
DGA results should not be interpreted in isolation. Confirm findings with:
- Transformer loading
- Temperature
- Maintenance records
- Electrical test results
- Previous inspection findings
- Operating events
Combining DGA data with operating and maintenance context improves diagnostic accuracy and supports sound maintenance decisions.
Historical DGA Trends and Fault Development
A single DGA result provides a snapshot of dissolved gas concentrations at the time of measurement. It shows what gases are present and at what levels, but it cannot by itself reveal whether a fault is stable, developing, or accelerating. For that, multiple DGA results over time are needed.
Historical trend analysis compares current gas concentrations with previous measurements, evaluating both the rate of increase and the pattern of change. This is particularly valuable because a relatively moderate gas concentration may still require attention if the rate of increase is high, while a stable concentration over a long period may indicate a dormant or resolved condition.
The following table summarizes how different trends may be interpreted:
| Trend | Possible Interpretation |
|---|---|
| Stable gas levels | No significant change in gas generation |
| Gradual increase | Developing condition may require monitoring |
| Rapid increase | Potentially active fault requiring investigation |
| Sudden appearance of a specific gas | Possible change in fault condition |
These interpretations are indicative only. Trend analysis should always be combined with gas ratios, diagnostic methods, and transformer operating conditions before drawing conclusions. A single abnormal trend does not confirm a fault, but it may indicate the need for closer monitoring, more frequent sampling, or further diagnostic testing.
Historical DGA trends are therefore not just a record of past measurements — they are an essential input for assessing fault development and planning timely maintenance.
DGA Fault Diagnosis: Identifying Transformer Fault Types
Transformer fault diagnosis using DGA combines dissolved gas concentrations, gas ratios, diagnostic methods, and historical trends to identify the most likely fault category. Different fault types generate characteristic gas patterns, which form the basis for classification.
Partial Discharge
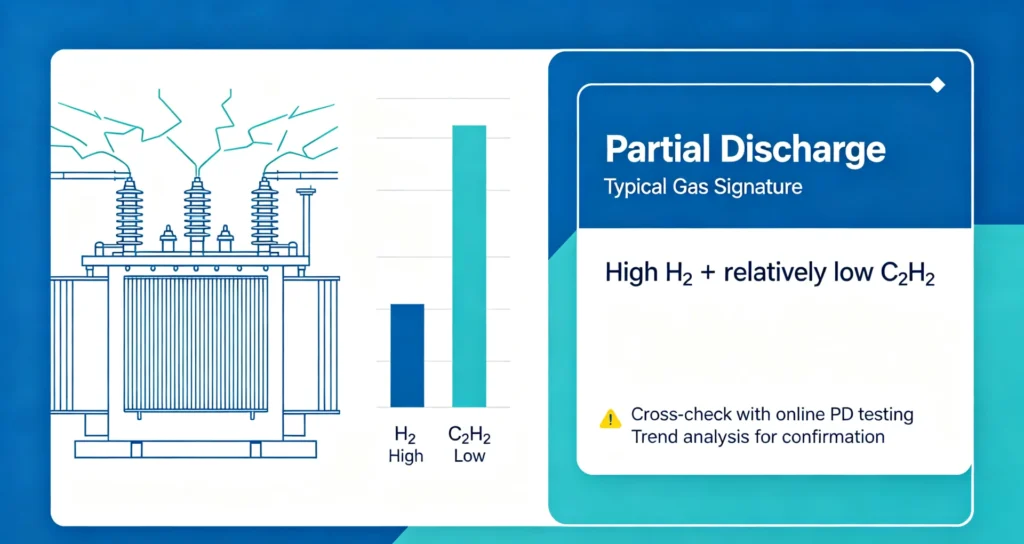
Partial discharge typically produces elevated H₂ and CH₄, with relatively low levels of other hydrocarbon gases. The gas pattern often shows a dominant hydrogen concentration, sometimes accompanied by trace amounts of C₂H₂. Diagnostic methods such as the Duval Triangle and Rogers Ratios help confirm whether the pattern falls within the partial discharge zone.
Low-Energy Discharge
Low-energy discharge, also known as sparking, generates elevated H₂ and CH₄, with small amounts of C₂H₂. The presence of acetylene distinguishes it from simple partial discharge. Gas ratios such as C₂H₂/C₂H₄ help characterize the discharge energy level and guide further investigation.
Arcing / High-Energy Discharge
Arcing or high-energy discharge produces significant amounts of C₂H₂ and H₂, often accompanied by elevated C₂H₄. The presence of acetylene is a key diagnostic indicator of arcing. Gas ratios such as C₂H₂/C₂H₄ and CH₄/H₂ are particularly important for confirming this fault type. Arcing represents a serious condition requiring urgent investigation.
Thermal Faults
Thermal faults are classified by temperature range and produce characteristic gas patterns:
- Low-temperature thermal fault: Elevated CH₄ and C₂H₆
- Medium-temperature thermal fault: Increasing C₂H₄ alongside CH₄ and C₂H₆
- High-temperature thermal fault: Dominant C₂H₄ with possible C₂H₂ formation
The Duval Triangle and IEC 60599 ratio methods are commonly used to distinguish between these thermal fault categories.
Cellulose Insulation Overheating
Cellulose insulation overheating involves the paper insulation rather than the oil, and is indicated by elevated CO and CO₂. The CO/CO₂ relationship provides additional insight: a relatively high CO/CO₂ ratio may suggest cellulose degradation, while changes in both gases over time indicate the severity of the condition. This fault type is often associated with thermal faults affecting solid insulation.
Integrating Diagnostic Results
No single gas pattern or diagnostic method should be used in isolation. Transformer fault diagnosis using DGA requires combining gas concentrations, gas ratios, diagnostic methods, and historical trends with operating and maintenance data to determine the most likely fault type and appropriate maintenance response.
DGA Results Interpretation Example
The following example demonstrates how DGA results can be interpreted step by step. The gas concentrations below are illustrative and should be replaced with actual measurement data in practice.
Example DGA Results
| Gas | Result |
|---|---|
| H₂ | 350 ppm |
| CH₄ | 120 ppm |
| C₂H₆ | 45 ppm |
| C₂H₄ | 95 ppm |
| C₂H₂ | 60 ppm |
| CO | 420 ppm |
| CO₂ | 3,200 ppm |
Step 1: Identify Abnormal Gases
Compare each gas against applicable limits such as IEC 60599 or IEEE C57.104, and against the transformer’s historical baseline. In this example, H₂, C₂H₂, and C₂H₄ are notably elevated, while CO and CO₂ also show moderate increases.
Step 2: Compare Historical Values
Check previous DGA results to determine whether these gases have been stable or are increasing. If C₂H₂ has appeared suddenly or is rising rapidly, this suggests an active fault condition rather than normal aging.
Step 3: Calculate Relevant Gas Ratios
Calculate key ratios:
- CH₄/H₂ = 120 ÷ 350 ≈ 0.34
- C₂H₂/C₂H₄ = 60 ÷ 95 ≈ 0.63
- C₂H₄/C₂H₆ = 95 ÷ 45 ≈ 2.11
Step 4: Apply IEC 60599 / Duval Triangle
Using the Duval Triangle with relative percentages of CH₄, C₂H₄, and C₂H₂:
- CH₄ ≈ 44%
- C₂H₄ ≈ 35%
- C₂H₂ ≈ 22%
The plotted point falls within a zone associated with arcing or high-energy discharge.
Step 5: Determine Possible Fault Category
Combining gas concentrations, ratios, and diagnostic methods, the most likely fault category is arcing or high-energy discharge, with possible involvement of cellulose insulation given the elevated CO and CO₂.
Step 6: Recommend Further Investigation
Recommended actions may include:
- Increase sampling frequency
- Perform additional electrical tests
- Review transformer loading and operating events
- Inspect for possible insulation damage
- Consider laboratory DGA verification
This example illustrates how DGA results interpretation moves from individual gas values to a structured diagnostic conclusion — and ultimately to actionable maintenance recommendations.
DGA Gas Interpretation Reference Table
| Observation | Possible Interpretation | Further Analysis |
|---|---|---|
| Elevated H₂ | Possible electrical activity | Check gas ratios and trend |
| Elevated C₂H₂ | Possible arcing | Confirm with other gases and diagnostic methods |
| Elevated C₂H₄ | Possible thermal activity | Evaluate temperature-related gas pattern |
| Rising CO/CO₂ | Possible cellulose degradation | Check trend and operating history |
Conclusion
Effective transformer DGA interpretation should combine gas concentrations, gas ratios, diagnostic methods, and historical trends rather than relying on a single gas value. A single DGA result provides only a snapshot; meaningful diagnosis comes from analyzing how gases relate to each other and how they change over time.
The interpretation process follows a logical sequence:
DGA Results → Analysis → Ratios → Diagnostic Method → Trend → Fault Diagnosis
Each stage builds on the previous one. Gas concentrations identify what is abnormal. Gas ratios reveal relationships between gases. Diagnostic methods such as IEC 60599, the Duval Triangle, and Rogers Ratios classify the fault type. Historical trends indicate whether the condition is stable, developing, or accelerating. Finally, combining these findings with operating and maintenance data produces a reliable fault diagnosis.
No single method or gas value should be used in isolation. DGA interpretation is most effective when multiple diagnostic approaches are cross-verified and when laboratory testing is used for final confirmation of complex abnormalities. By following this structured approach, transformer engineers, asset managers, and maintenance teams can turn DGA data into timely, actionable maintenance decisions — extending transformer service life and reducing unplanned outage risks.
FAQ About DGA Results Interpretation
What is DGA results interpretation?
DGA results interpretation is the process of evaluating dissolved gas concentrations in transformer oil to identify abnormal gas generation, analyze gas relationships and trends, and determine the possible type and severity of transformer faults.
How do you interpret DGA results?
To interpret DGA results, start by checking individual gas concentrations, then identify abnormal gases by comparing them with applicable limits or historical values. Next, analyze gas ratios, apply a diagnostic method such as IEC 60599, the Duval Triangle, or Rogers Ratios, and review historical trends. Finally, confirm findings with operating and maintenance data before determining the most likely fault type.
What gases are analyzed in transformer DGA?
Transformer DGA analysis typically covers H₂, CH₄, C₂H₆, C₂H₄, C₂H₂, CO, and CO₂. Some systems also measure O₂, N₂, and moisture. Each gas provides different diagnostic clues related to thermal faults, electrical discharges, and insulation degradation.
How does DGA diagnose transformer faults?
DGA fault diagnosis combines gas concentrations, gas ratios, diagnostic methods, and historical trends to identify the most likely fault category — such as partial discharge, low-energy discharge, arcing, thermal faults, or cellulose insulation overheating. No single gas value is sufficient on its own.
What is transformer DGA interpretation?
Transformer DGA interpretation is the structured analysis of dissolved gas data to assess transformer condition and identify developing faults. It goes beyond reading individual gas values by considering gas combinations, ratios, generation rates, and changes over time.
Can DGA identify transformer faults?
Yes. Transformer fault diagnosis using DGA can identify many common fault types, including partial discharge, arcing, thermal faults, and cellulose insulation degradation. However, DGA cannot detect all transformer faults — only those accompanied by gas generation. Complex or ambiguous cases may require laboratory verification and additional electrical testing.
References & Technical Sources
- IEEE C57.104-2019, IEEE Guide for the Interpretation of Gases Generated in Mineral Oil-Immersed Transformers
- IEC 60599:2022, Mineral oil-filled electrical equipment in service – Guidance on the interpretation of dissolved and free gases analysis
- IEC 60422:2013, Mineral insulating oils in electrical equipment – Supervision and maintenance guidance
- IEC 60567, Oil-filled electrical equipment – Sampling of gases and analysis of free and dissolved gases
- Duval, M. The Duval Triangle for power transformer fault diagnosis, IEEE Electrical Insulation Magazine
[…] Diagnostic methods such as IEC 60599, the Duval Triangle, Rogers Ratio, and Key Gas Method can be used to interpret gas patterns after an abnormal condition has been identified. These methods classify the suspected fault type and support consistent, repeatable diagnosis. Detailed calculation examples are covered in DGA Results Interpretation. […]