

Introduction
The Duval Triangle is a graphical diagnostic method used to interpret dissolved gas analysis (DGA) results and identify possible fault types in oil-immersed transformers.
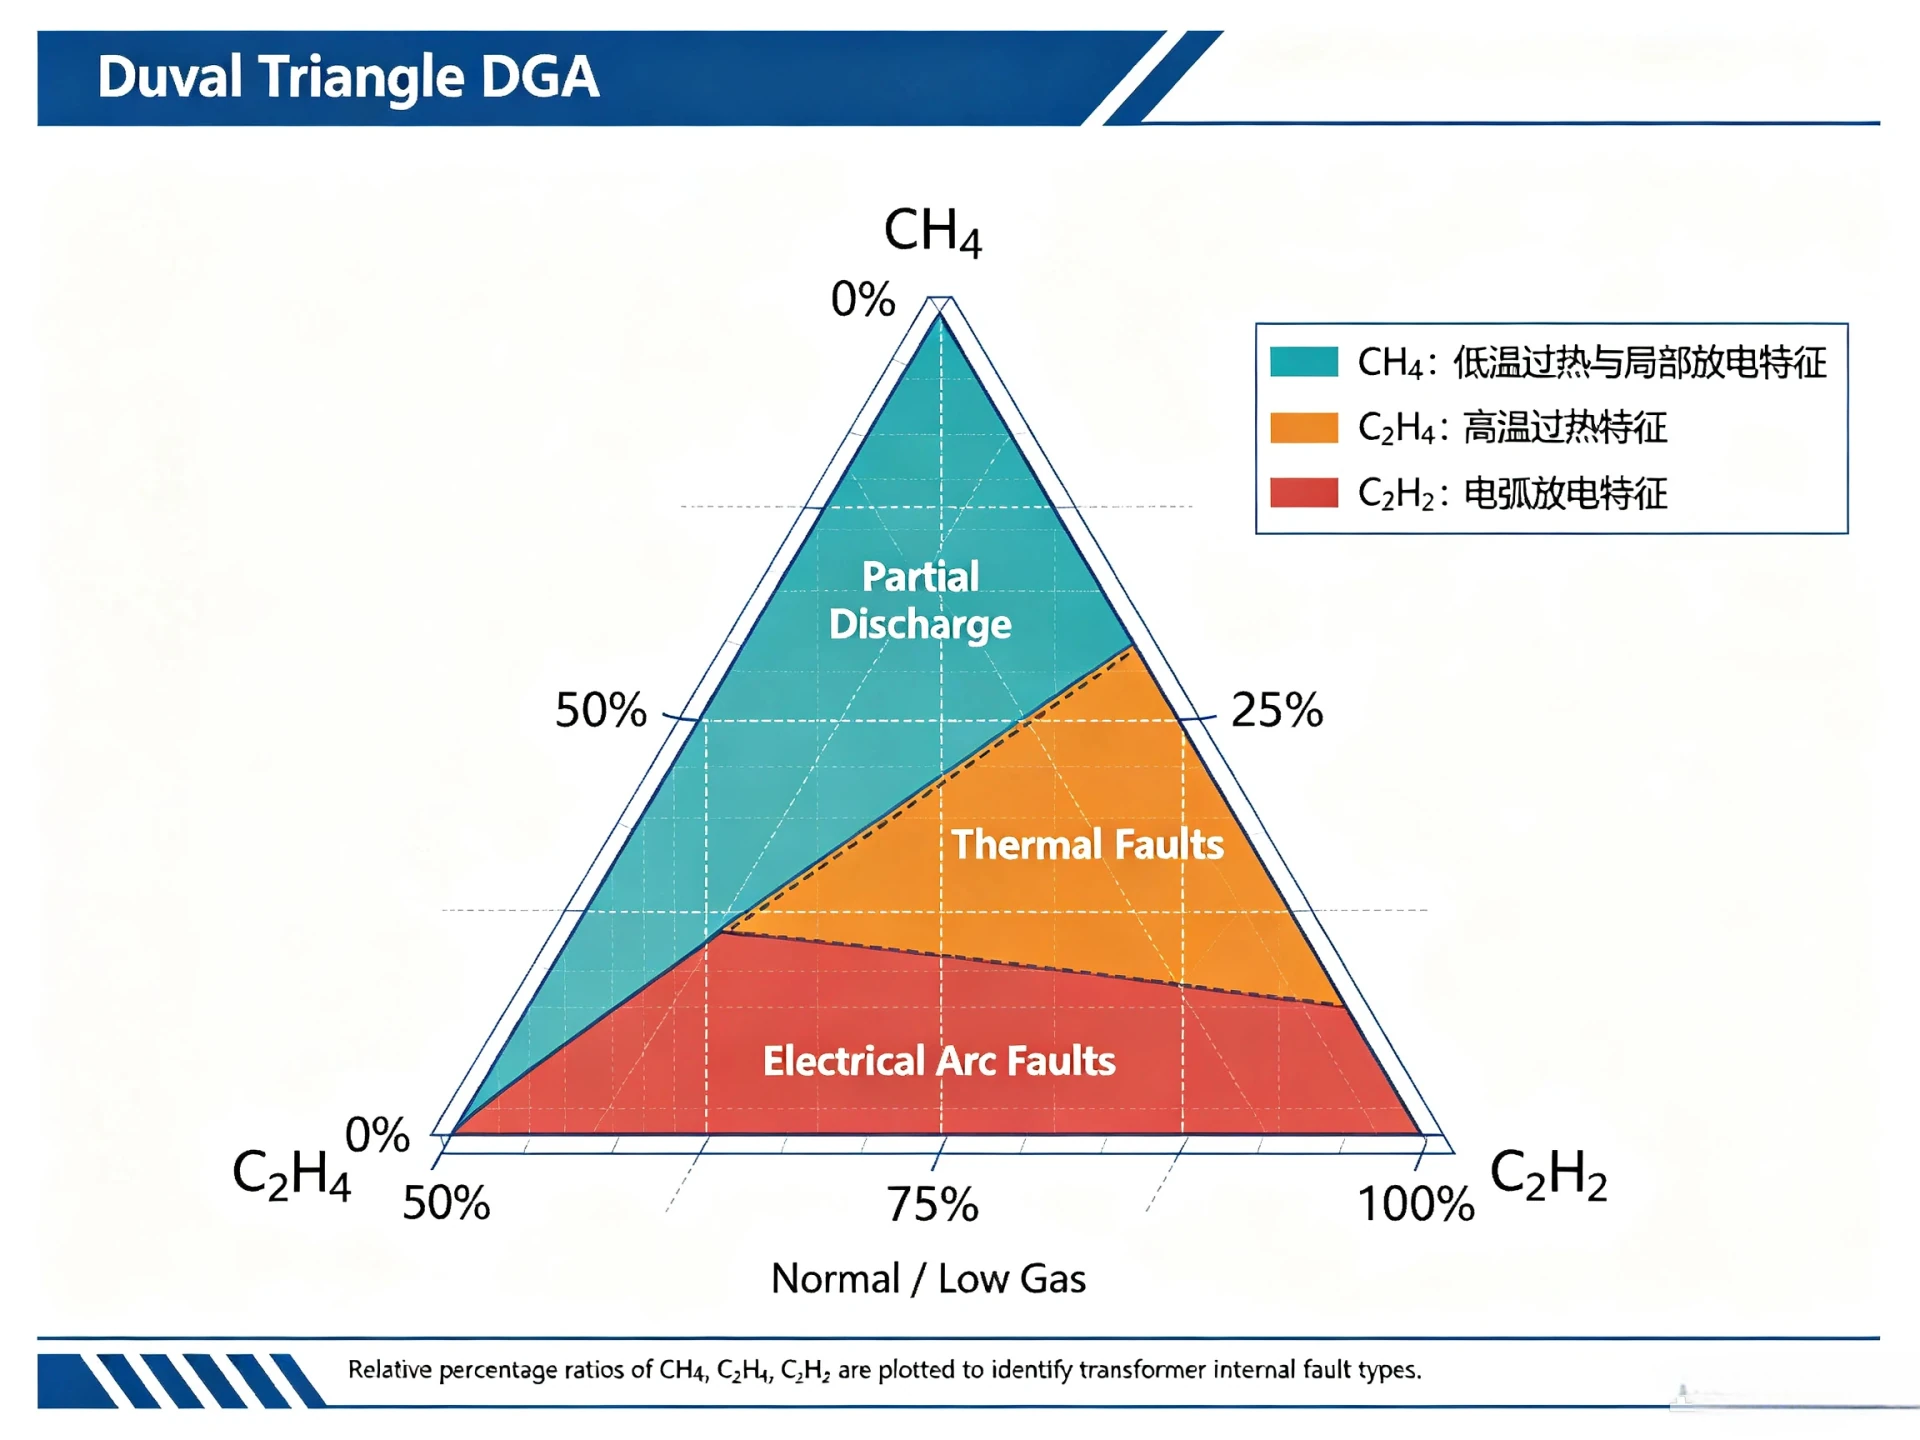
The Duval Triangle DGA approach uses the relative concentrations of methane (CH₄), ethylene (C₂H₄), and acetylene (C₂H₂) to classify possible transformer fault conditions.
These three gases are plotted as percentage values on a triangular diagram, and their relative proportions determine the position of the plotted point. The diagram is divided into distinct fault zones, and the zone in which the point falls indicates the likely fault type — such as partial discharge, thermal fault, or arcing.
Because it presents gas relationships visually rather than relying on individual values, the Duval Triangle is widely used alongside IEC 60599 and Rogers Ratios in transformer fault diagnosis.
What Is the Duval Triangle?
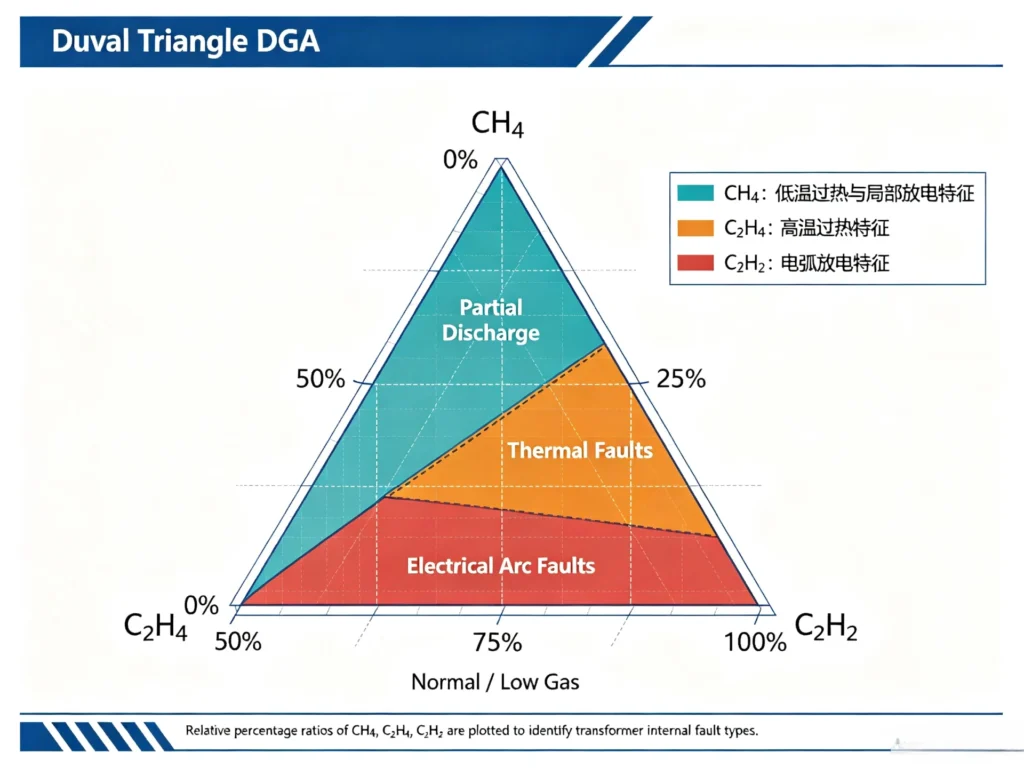
The Duval Triangle is a graphical diagnostic method used for interpreting dissolved gas analysis results in oil-immersed transformers. It provides a visual way to classify possible fault types based on the relative proportions of three key gases.
| Parameter | Description |
|---|---|
| Method | Duval Triangle |
| Input | DGA gas concentrations |
| CH₄ | Methane |
| C₂H₄ | Ethylene |
| C₂H₂ | Acetylene |
| Output | Possible fault classification |
| Application | Oil-filled transformers |
The Duval Triangle for transformer DGA diagnosis uses the relative percentages of CH₄, C₂H₄, and C₂H₂ to determine a plotted point on a triangular diagram. The position of this point indicates the likely fault category, such as partial discharge, thermal fault, or arcing. Because it relies on gas relationships rather than individual values, the method offers a clear, repeatable approach for interpreting DGA results.
How Does the Duval Triangle Work?
The Duval Triangle works by converting three gas concentrations into relative percentages, plotting them on a triangular diagram, and identifying the fault zone in which the plotted point falls.
The Three DGA Gases Used
The Duval Triangle uses three key gases:
- CH₄ — methane
- C₂H₄ — ethylene
- C₂H₂ — acetylene
The Duval Triangle uses the relative proportions of these three gases rather than their absolute concentrations alone. This is why the method requires percentage calculation before plotting.
H3: Why CH₄, C₂H₄ and C₂H₂ Are Used
These three gases are selected because their relative proportions provide diagnostic value across different fault conditions:
- CH₄ is associated with lower-temperature thermal activity
- C₂H₄ is associated with higher-temperature thermal activity
- C₂H₂ is associated with arcing and high-energy electrical discharge
Together, their proportions help distinguish between thermal faults, electrical discharges, and arcing conditions. For detailed explanations of each gas, see What Do DGA Gases Mean?
Gas Percentage Calculation
The Duval Triangle uses relative gas percentages, calculated as follows.
Let:
- CCH₄ = methane concentration
- CC₂H₄ = ethylene concentration
- CC₂H₂ = acetylene concentration
Total concentration:
Ctotal = CCH₄ + CC₂H₄ + CC₂H₂
Then:
- CH₄% = CCH₄ ÷ Ctotal × 100
- C₂H₄% = CC₂H₄ ÷ Ctotal × 100
- C₂H₂% = CC₂H₂ ÷ Ctotal × 100
The three percentages always sum to 100%:
CH₄% + C₂H₄% + C₂H₂% = 100%
These percentage values are then plotted on the Duval Triangle to determine the likely fault zone.
How to Calculate the Duval Triangle DGA Result
Calculating a Duval Triangle DGA result follows four clear steps: obtain the gas concentrations, calculate the total, convert to percentages, and plot the point.
Step 1: Obtain DGA Gas Concentrations
Obtain the concentrations of the three required gases from the same DGA sample:
- CH₄ — methane
- C₂H₄ — ethylene
- C₂H₂ — acetylene
Concentrations are typically expressed in ppm. Use gas concentrations from the same DGA sample to ensure consistency.
Step 2: Calculate Total Gas Concentration
Add the three gas concentrations together:
Total = CH₄ + C₂H₄ + C₂H₂
Step 3: Convert the Gas Concentrations to Percentages
Calculate the relative percentage of each gas:
- CH₄% = CH₄ ÷ Total × 100
- C₂H₄% = C₂H₄ ÷ Total × 100
- C₂H₂% = C₂H₂ ÷ Total × 100
Example
| Gas | Concentration |
|---|---|
| CH₄ | 40 ppm |
| C₂H₄ | 50 ppm |
| C₂H₂ | 10 ppm |
| Total | 100 ppm |
Resulting percentages:
- CH₄ = 40%
- C₂H₄ = 50%
- C₂H₂ = 10%
Step 4: Plot the Point
The three percentages define a point within the triangular coordinate system. The location of this point determines which diagnostic zone it falls into, and each zone corresponds to a possible fault type. This leads directly to the interpretation of the Duval Triangle result in the next section.
How to Read and Interpret the Duval Triangle
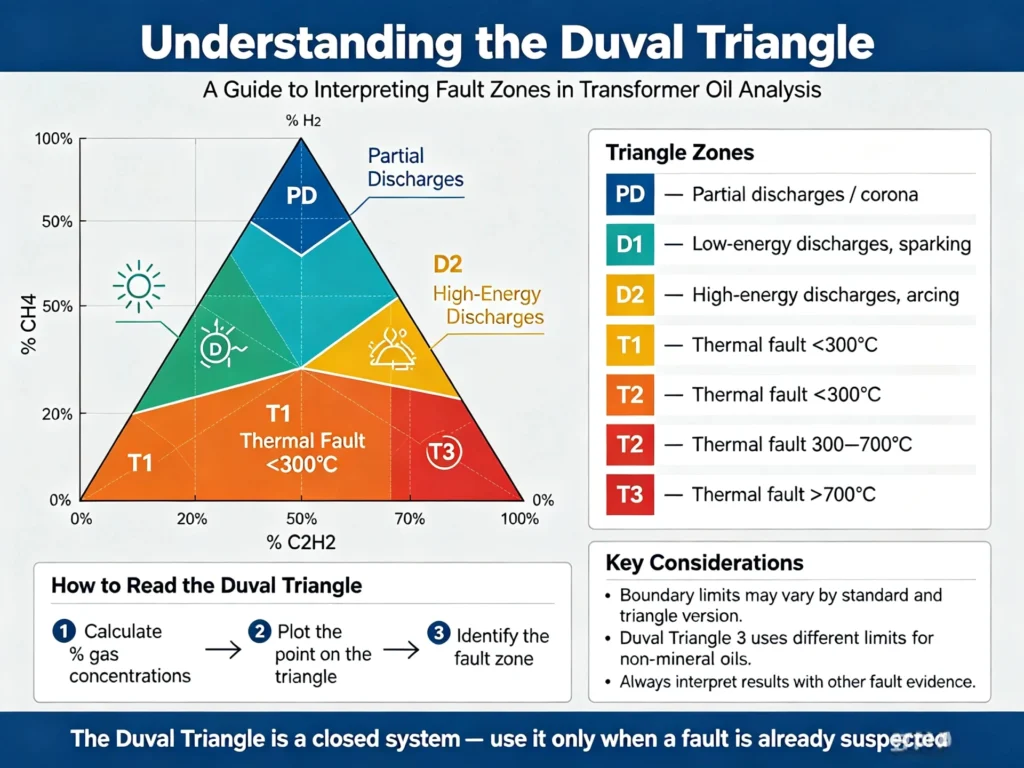
The Duval Triangle is read by plotting the calculated percentage point on the triangular diagram and identifying which fault zone it falls into. Each zone corresponds to a specific fault type.
Understanding the Triangle Zones
Using the standard Duval Triangle 1, the typical fault zones are:
| Zone | Fault Type |
|---|---|
| PD | Partial Discharges |
| D1 | Low-energy electrical discharges |
| D2 | High-energy electrical discharges |
| T1 | Thermal fault <300°C |
| T2 | Thermal fault 300–700°C |
| T3 | Thermal fault >700°C |
The PD zone indicates partial discharge or corona-type activity, typically caused by localized dielectric breakdown under high voltage stress. D1 represents low-energy discharges such as sparking, which may produce small carbonized punctures in paper insulation. D2 represents high-energy discharges or arcing, associated with extensive carbonization, metal fusion, and possible equipment tripping.
The thermal zones are distinguished by temperature range. T1 indicates thermal faults below 300°C, where paper insulation may turn brownish in color. T2 covers thermal faults between 300°C and 700°C, where paper begins to carbonize. T3 indicates thermal faults above 700°C, evidenced by oil carbonization, metal coloration, or metal fusion.
The boundary between D1 and D2, and between T1/T2/T3, may vary depending on the specific Duval Triangle version and the standard being referenced. For example, Duval Triangle 3, used for non-mineral oils, has different zone boundaries for D1/D2, T1/T2, and T2/T3 compared to Triangle 1.
Fault-zone definitions should be interpreted according to the applicable Duval Triangle method and standard/reference being used.
The Duval Triangle method is a “closed” system — every possible combination of gas percentages results in a fault classification, with no area designated as normal. This means the method should only be used to identify a fault when other information already indicates a fault is likely to exist.
Duval Triangle Transformer Fault Diagnosis
Duval Triangle transformer fault diagnosis uses the plotted percentage point to classify the likely fault type. Each zone represents a different fault category, and the zone in which the point falls indicates the most probable condition.
| Zone | Fault Type | General Description |
|---|---|---|
| PD | Partial Discharge | Low-energy discharge activity |
| D1 | Low-energy Discharge | Developing electrical discharge |
| D2 | High-energy Discharge | More severe electrical discharge |
| T1 | Low-temperature Thermal Fault | Thermal activity below 300°C |
| T2 | Medium-temperature Thermal Fault | Thermal activity around 300–700°C |
| T3 | High-temperature Thermal Fault | Thermal activity above 700°C |
PD — Partial Discharge
The point falls within the PD zone when the gas proportions are associated with partial-discharge activity. This typically indicates low-energy discharge behavior, often caused by localized dielectric stress.
D1 — Low-energy Discharge
D1 indicates a developing electrical discharge with relatively low energy. It may involve sparking or small carbonized punctures in paper insulation. While less severe than D2, it still warrants investigation.
D2 — High-energy Discharge
D2 indicates a more severe electrical discharge, often associated with arcing. This condition may cause extensive carbonization, metal fusion, and possible equipment tripping. It generally requires prompt engineering attention.
T1 — Low-temperature Thermal Fault
T1 corresponds to thermal activity below 300°C. Paper insulation may show brownish discoloration, but the condition is typically less severe than higher-temperature faults.
T2 — Medium-temperature Thermal Fault
T2 covers thermal activity around 300–700°C. At this stage, paper insulation begins to carbonize, indicating a more developed thermal condition.
T3 — High-temperature Thermal Fault
T3 indicates thermal activity above 700°C. This may be evidenced by oil carbonization, metal coloration, or metal fusion. It represents a serious thermal condition, though the zone classification alone does not predict when or whether the transformer will fail.
The Duval Triangle provides a structured way to classify possible fault types, but the result should always be interpreted together with gas concentrations, historical trends, and operating conditions. It is a diagnostic aid, not a stand-alone failure prediction.
What Does a Boundary Point Mean?
A point located close to the boundary between two fault zones should not be interpreted as a definitive diagnosis. When the plotted point falls near a boundary line, the result may suggest characteristics of both adjacent zones, and the classification becomes less certain.
In such cases, additional factors should be considered:
- Historical DGA data — whether gas levels and ratios have been stable or changing
- Gas generation rate — whether gas is being produced slowly or rapidly
- Operating condition — load, temperature, and recent operating events
- Other diagnostic methods — IEC 60599 ratios, Rogers Ratios, or Key Gas Method
- Additional testing — laboratory verification, electrical tests, or insulation inspection
Boundary cases are common in practice. Rather than forcing a single classification, engineers should treat the result as an indication that further evaluation is needed. The Duval Triangle provides a visual diagnostic aid, but it works best when combined with trend analysis and other diagnostic information.
For a complete step-by-step interpretation process, see DGA Results Interpretation.
Duval Triangle and Online DGA Monitoring
Online DGA monitoring and the Duval Triangle serve different but complementary roles. Online DGA monitoring provides continuously updated gas data, while the Duval Triangle is a diagnostic method used to interpret selected gas proportions.
The relationship can be summarized as follows:
Online DGA Monitoring
↓
Continuous Gas Measurement
↓
CH₄ / C₂H₄ / C₂H₂ Data
↓
Duval Triangle Analysis
↓
Fault Classification
↓
Condition Assessment
Online DGA monitoring supplies the CH₄, C₂H₄, and C₂H₂ concentrations needed for the calculation. The Duval Triangle then converts these concentrations into relative percentages and plots them on the triangular diagram to identify the likely fault zone. When gas data is updated continuously, the Duval Triangle result can be recalculated as conditions change, supporting ongoing condition assessment rather than a one-time diagnosis.
This combination is particularly useful for tracking whether a fault is stable, developing, or resolving. A point that remains within the same zone over time may indicate a stable condition, while a point that shifts toward a different zone may suggest a developing fault requiring closer attention.
The Duval Triangle does not replace online DGA monitoring, and online DGA monitoring does not replace diagnostic interpretation. Together, they connect continuous gas measurement with structured fault classification.
Example of Duval Triangle DGA Interpretation
The following example demonstrates how the Duval Triangle is applied in practice.
Step 1: Obtain Gas Concentrations
| Gas | Concentration |
|---|---|
| CH₄ | 40 ppm |
| C₂H₄ | 50 ppm |
| C₂H₂ | 10 ppm |
Step 2: Calculate Total Concentration
Total = CH₄ + C₂H₄ + C₂H₂ = 40 + 50 + 10 = 100 ppm
Step 3: Convert to Percentages
- CH₄% = 40 ÷ 100 × 100 = 40%
- C₂H₄% = 50 ÷ 100 × 100 = 50%
- C₂H₂% = 10 ÷ 100 × 100 = 10%
Step 4: Plot the Point
Plot the point using the three calculated percentages. The point should then be compared with the applicable Duval Triangle fault zones to determine which zone it falls into.
Step 5: Interpret the Result
Once the zone is identified, refer to the zone definitions to determine the possible fault type. For example:
- If the point falls in the PD zone, it may indicate partial discharge.
- If it falls in the D1 or D2 zone, it may indicate low-energy or high-energy discharge.
- If it falls in the T1, T2, or T3 zone, it may indicate a thermal fault of increasing severity.
The Duval Triangle result should not be interpreted in isolation. It should be considered together with gas concentrations, historical trends, gas generation rates, and operating conditions.
Note: The example above illustrates the calculation procedure only. To determine the actual fault zone, use the applicable Duval Triangle diagram with accurate coordinates and the relevant standard or reference.
Limitations of the Duval Triangle
The Duval Triangle is a widely used diagnostic tool, but it has limitations that engineers should understand before relying on its output.
1. It is not a standalone diagnosis
The Duval Triangle classifies possible fault types based on three gas percentages, but it does not confirm a fault on its own. It should be combined with other DGA information, such as gas concentrations, gas ratios, and historical trends, before drawing conclusions.
2. Boundary points require caution
A point falling close to the boundary between two zones should not be interpreted as a definitive classification. In such cases, the result may share characteristics of both adjacent zones, and further evaluation is needed.
3. Historical trends matter
A single sample provides only a snapshot. The Duval Triangle result should be evaluated alongside historical DGA data to determine whether the condition is stable, developing, or accelerating. A point that shifts over time may be more informative than a single plotted position.
4. Different diagnostic methods may produce different classifications
The Duval Triangle does not always agree with other diagnostic methods such as IEC 60599, Rogers Ratio, or Key Gas Method. When results differ, cross-verification and engineering judgment are required rather than relying on a single method.
5. Gas quality and measurement quality matter
If the original DGA data is unreliable — due to sampling errors, sensor drift, or measurement inaccuracy — the graphical diagnosis will also be unreliable. Accurate gas concentration data is a prerequisite for meaningful Duval Triangle analysis.
Understanding these limitations helps engineers use the Duval Triangle appropriately: as a structured diagnostic aid, not as a stand-alone fault confirmation tool.
DGA Fault Diagnosis Checklist
| Check | Question |
|---|---|
| DGA data | Are CH₄, C₂H₄ and C₂H₂ available? |
| Sample | Are the three gas values from the same sample? |
| Calculation | Were gas percentages calculated correctly? |
| Plotting | Was the point plotted correctly? |
| Fault zone | Which Duval zone contains the point? |
| Boundary | Is the point close to a zone boundary? |
| Trend | Does historical DGA data support the result? |
| Diagnosis | Does another diagnostic method support the interpretation? |
| Action | Is additional testing required? |
FAQs About Duval Triangle DGA
1. What is the Duval Triangle in transformer DGA?
It is an IEC 60599-recommended graphical fault classification method that judges transformer thermal and electrical faults through the proportional distribution of CH₄, C₂H₄, and C₂H₂.
2. Which gases does the Duval Triangle use?
The classic version uses three core gases: methane (CH₄), ethylene (C₂H₄), and acetylene (C₂H₂).
3. How to calculate Duval Triangle percentages?
Divide each single gas concentration by the total of the three gases and multiply by 100% to get the proportional percentage.
4. What do T1, T2, T3 mean?
They represent low, medium, and high-temperature thermal faults inside the transformer respectively, corresponding to different overheating severity levels.
5. What do D1 and D2 mean in DGA?
D1 stands for low-energy slight discharge, and D2 stands for high-energy dangerous arcing discharge.
6. Can the Duval Triangle detect partial discharge?
It can assist in identifying PD zone characteristics, but partial discharge faults need comprehensive verification combined with H₂ data and live detection results.
7. Is the Duval Triangle part of IEC 60599?
It is a recommended graphical diagnostic technique in the IEC 60599:2022 standard, serving as an important implementation tool for standard DGA interpretation.
8. Can it be used with online DGA monitoring?
Yes. Embedding Duval Triangle algorithm in online DGA systems can realize automatic real-time fault classification and trend early warning.
9. Is the Duval Triangle enough for final fault diagnosis?
No. It is only an auxiliary classification tool. Reliable diagnosis requires multi-data and multi-method comprehensive verification.
Conclusion
The Duval Triangle method is a visual, efficient, and industry-standard auxiliary technology for DGA fault diagnosis. It converts complex dissolved gas data into intuitive fault zoning results through standardized three-gas proportional calculation and graphical plotting, providing clear judgment basis for transformer oil DGA state evaluation.
For engineering O&M and EPC project applications, the Duval Triangle cannot be used as a single diagnostic basis. Standardized diagnosis must integrate gas concentration values, long-term trend data, auxiliary gas indicators, transformer operating conditions, and IEC 60599 standard specifications. Combined with high-precision online DGA monitoring systems, it can realize accurate early warning of incipient faults, effectively avoid transformer unplanned outages, and improve the overall safety and economy of power asset operation.
Reference & Technical Sources
- IEC 60599:2022, Mineral oil-filled electrical equipment in service – Guidance on the interpretation of dissolved and free gases analysis
- GE Vernova, Transformer Health Monitoring & DGA Diagnostic Technical Specification
- IET Research, Traditional Fault Diagnosis Methods for Mineral Oil-Immersed Power Transformer
- CIGRE TB 771, Transformer Dissolved Gas Analysis Interpretation Guidelines
- Seetalabs Technical Report: Duval Triangle Interpretation and Limitation Specification
[…] diagnostic logics that can be perfectly matched with graphical auxiliary tools. Among them, the Duval Triangle DGA method is the most widely used engineering auxiliary means. It uses the relative proportion of […]
[…] Duval Triangle […]